
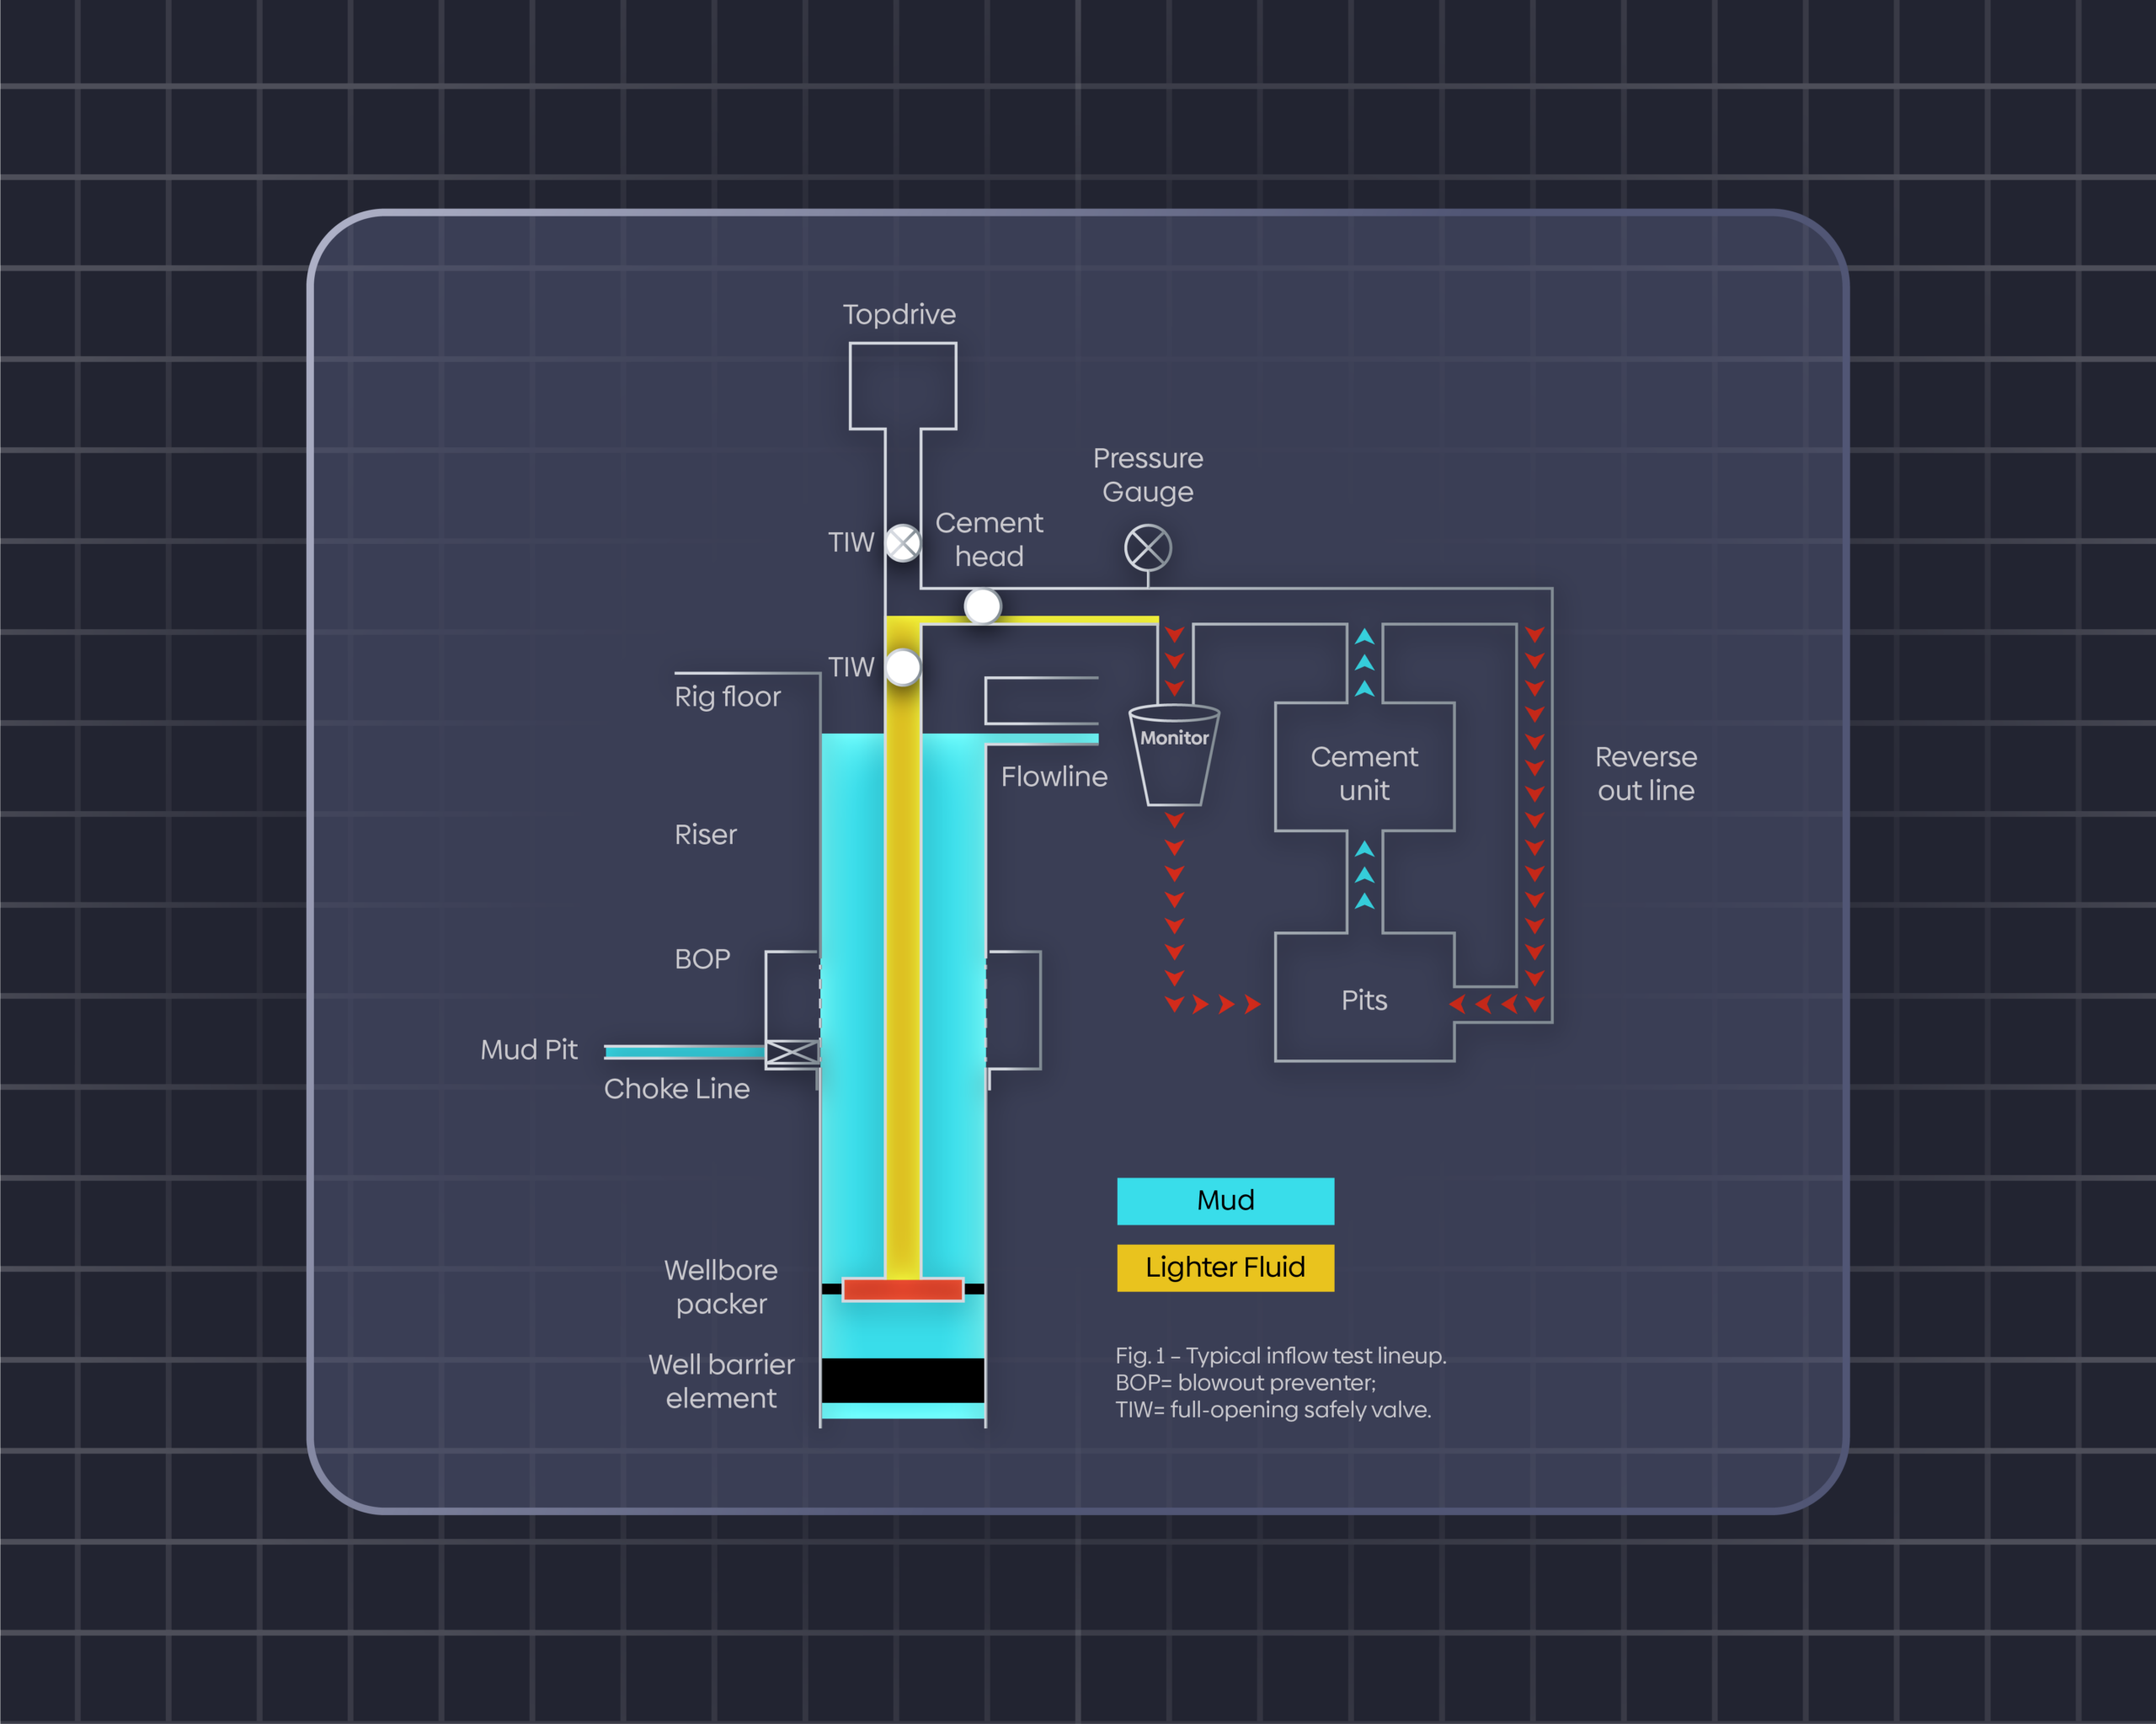
Negative pressure testing, also known as inflow testing, is a reliable way to verify well barrier integrity and remain in compliance with the Code of Federal Regulations (CFR) Title 30 § 250.721(g). During a negative pressure test, heavier fluid in the well is replaced with a lighter one. This reduces the pressure pushing down on the barrier, so the barrier has to hold back pressure from the formation below. The well is then monitored for flow or pressure buildup, either of which could indicate a leak.
For years, Horner analysis was widely used to interpret negative test results. More recent research has concluded that it shouldn’t be used for this purpose at all, because it relies on assumptions that don’t hold during a negative pressure test. Here’s why.
How Horner Analysis Works
Horner analysis is a well testing method developed in the 1950s to estimate reservoir pressure based on how pressure builds up after a well is shut in. The results are shown on a Horner plot which, according to Crane’s Petrophysical Handbook, is “a cross plot of buildup (or drawdown) pressure (Pi) on the Y-axis versus a dimensionless time coefficient (HTi), usually called Horner Time, on a logarithmic X-axis.” The slope of the resulting line is used to interpret conditions downhole.
Horner analysis is based on the radial flow equation that describes pressure buildup in shut-in wells. That equation turned out to have enough in common with thermal diffusion equations that it could also be used to predict static formation temperature. Because negative pressure tests create thermal effects that can cause flowback, Horner analysis seemed like a logical choice for interpreting test results.
Why Horner Analysis Doesn’t Fit Inflow Tests
The problem is that Horner analysis relies on assumptions that don’t match what happens in the well during a negative pressure test. Using it requires ignoring temperature change, heat generation, and heat transfer between fluids. It also assumes that system and formation temperatures stay the same as pressure changes, that formation temperature doesn’t vary with distance from the wellbore, and that temperature is consistent at the wellbore. None of these assumptions hold during a negative pressure test.
As a result, even small changes in these variables can produce a trend line that is easily misinterpreted. This led James Peyton to conclude in a paper published in SPE Drilling & Completions that Horner analysis “should not be used for analyzing flowback or pressure buildup during an inflow test.” Fortunately, there is a more reliable approach.
A More Reliable Approach to Negative Pressure Testing
IPT Global’s SureTec® PressureTesting solution is built to account for what Horner analysis leaves out. Using proprietary algorithms, it separates pressure changes caused by temperature from those caused by a leak, so a thermal effect isn’t mistaken for a barrier failure, and a real leak isn’t written off as a thermal effect.
Test data is captured digitally and evaluated against the required pass-fail criteria, so every test gets an objective, consistent result that doesn’t depend on interpreting a trend line by eye. Each test is also documented automatically, creating a clear record for regulatory compliance and audits.
Results can be viewed onsite or remotely, so onshore teams can follow tests as they happen. And if you need support, experts at IPT Global’s Real-Time Operations Center are available 24/7.
Contact IPT Global to learn how PressureTesting can bring more confidence to your negative pressure tests.