
IPT Global, the pioneer and recognized global leader in digital well assurance solutions and associated advisory services to the oil and gas industry, today announced that it has received official approval from the Bureau of Safety and Environmental Enforcement (BSEE) to serve as primary validation provider of inflow tests in the Gulf of America (GoA).
This approval is the first of its kind and marks a major milestone for IPT Global and the broader offshore industry.
The multi-year approval process included direct engagement with BSEE, detailed technical evaluations, and close collaboration with six offshore operators. As part of the validation pathway, IPT Global also completed a multi-month independent review conducted by DNV to support the use of SureTec® for inflow test validation. In addition, the IPT Global team conducted multiple training sessions with BSEE engineers and inspectors to ensure full alignment on procedures, regulatory expectations, and compliance requirements, reinforcing the technical rigor and transparency behind this approval.
This designation establishes IPT Global as the first approved provider for primary validation of inflow tests in the GoA, setting a new benchmark for independent validation and regulatory collaboration in offshore operations.
See our announcement in the May/June 2026 edition of Drilling Contractor Magazine.
For media enquiries or additional information about IPT Global, please contact [email protected].
In a controlled offshore field trial, a major operator evaluated two competing approaches to BOP pressure testing and well barrier verification on sister drillships in the Gulf of America. The objective: determine which solution delivered faster, more accurate validation of well control equipment performance.
Traditional predictive analysis methods, commonly used in pressure decline analysis, rely on assumed coefficients rather than actual test data. This introduces uncertainty in well barrier testing, especially in complex subsea environments.
Operators required a solution that could:
IPT Global deployed its SureTec® PressureTesting Solution, a digital pressure testing software with a patented advanced analysis engine that leverages thermally compensated leak detection (TCLD).
Unlike conventional methods, TCLD:
This approach aligns with modern barrier management software strategies and supports BOP real-time monitoring across offshore operations.
Field trial results confirmed a clear performance advantage:
The operator concluded that SureTec PressureTesting provided superior efficiency and assurance in subsea BOP testing and overall well control equipment performance. This resulted in the operator changing their digital pressure testing provider from a competing company to IPT Global across all offshore operations.
As the oil and gas industry moves toward digital transformation, relying on assumption-based models is no longer sufficient. Advanced analytics provided through IPT Global’s SureTec platform deliver:
For operators seeking to optimize bop testing, well barrier element pressure tests, and inflow pressure testing, adopting real-time, data-driven analysis is critical.
Predictive models estimate. IPT Global validates.
In offshore drilling, BOP testing is a critical component of well barrier assurance. However, inconsistent processes across rigs can lead to incorrect line-ups, missed tests, and operational risk. This case study examines how the IPT Global Service Delivery Team supported an operator to improve BOP testing performance across a five-rig fleet in the Gulf of Mexico using SureTec® PressureTesting.
Across a five-rig fleet operating in the Gulf of America, incorrect line-ups (sometimes known as misalignments) during BOP tests occurred up to 60% of the time. The potential of executing BOP pressure tests with these errors increased safety risk and decreased operational efficiencies. The difference across rigs wasn’t equipment or operator. It was the consistency of the application of the well barrier assurance testing process by rig crews. The operator requested IPT Global’s support across the fleet to ensure a common baseline performance level was maintained across the rigs.
In offshore drilling operations, performance gaps between similar rigs working together with the same operator are common. Crew experience, familiarity with procedures, and operational maturity all vary. What doesn’t vary, however, is the consequence of a missed well barrier test. Incorrect line-ups undetected during BOP testing can leave critical components untested, create regulatory and environmental exposure, and compound into costly rig downtime.
To help establish a standardized approach, the IPT Global Real-Time Operations Center (RTOC) conducted a fleet-wide analysis of all BOP pressure tests over the course of one year. The results illustrate both the scale of the problem and the value of a consistent, technology-backed assurance framework, regardless of individual rig performance.
A fleet-wide analysis of 76 BOP pressure tests highlights both the scale of incorrect line-ups and the impact on offshore drilling performance.
When results are broken down by rig, the variance is stark and highlights a critical point: performance is driven by the consistent application of robust processes and assurance.
| Rig | No. of BOP Tests | Tests with Incorrect Line-ups | Missed Incorrect Line-ups Detected by RTOC | Lost Time (min) |
| Rig A | 17 | 59% | 5 tests (29%) | 270 |
| Rig B | 18 | 56% | 3 tests (17%) | 165 |
| Rig C | 8 | 13% | — | 5 |
| Rig D | 20 | 5% | — | 8 |
| Rig E | 13 | 0% | — | 0 |
The rigs with the lowest incorrect line-up rates share a common thread: a standardized, familiar process developed or supported by the IPT Global Service Delivery Team. Rig C operates with a full-time IPT Global Field Advisor supporting BOP testing execution and well barrier assurance processes embedded with the crew. The one incorrect line-up it recorded during the year was caught immediately by that IPT Global team member. Rig D had IPT Global Field Advisors on location for an extended period who helped build simplified, consistent test plans; the crew became deeply familiar with those plans, and the data reflects it. Rig E recorded zero incorrect line-ups across all 13 tests.
Rigs A and B tell a different story. Rig A recorded a total of 15 incorrect line-ups during BOP testing operations. This was the highest in the fleet and impacted 59% of its BOP tests, with the frequency trending upward as the year progressed. Rig A’s crew had recently been blended from two different drilling contractors, introducing unfamiliarity. IPT Global Field Advisors were not present onboard for BOP testing, though the IPT Global Service Delivery Team remotely identified five incorrect line-ups that were undetected by rig personnel. This accounted for three and a half hours of intervention time that would otherwise have resulted in undetected deviations.
Rig B showed a persistent failure at a specific test step with incorrect line-ups occurring in 56% of all tests, traceable to an incorrect cementer line-up that went uncorrected over multiple test cycles.
This is not a story about which rigs have better crews or stronger safety cultures. It is a demonstration of what happens when a standardized well barrier assurance and BOP testing process is applied consistently across a fleet, and what happens when it isn’t.
Every rig has its own dynamics: crew experience, contractor mix, familiarity with test plans, and operational culture and tempo. IPT Global does not override these dynamics. Instead, the SureTec PressureTesting software provides a standardized well barrier assurance framework for BOP testing, combining real-time monitoring, structured verification processes, and field expertise that operates independently of them.
Where a rig is already performing well, this approach reinforces and documents the behavior. Where performance is inconsistent, it identifies deviations early, before they become compliance events, safety incidents, or compounding downtime.
The data makes this clear. The eight incorrect line-ups missed by onboard crew but detected through real-time monitoring and structured BOP testing verification via PressureTesting and the IPT Global RTOC were identified through a consistent, structured process combining volume benchmarking, step-by-step checklist verification, and direct communication protocols, applied consistently and independently of rig floor activity.
Operators managing multiple assets simultaneously in offshore drilling operations face these same challenges at a larger scale. Performance varies, crews turn over, and experience levels differ. While a fleet-wide assurance program like SureTec PressureTesting does not remove these variables, it does establish a consistent baseline, ensuring performance gaps do not go undetected.
The rigs that performed best were not immune to incorrect line-ups. They were simply better equipped through familiarity, simplified plans, and consistent oversight to prevent or catch them early. IPT Global’s role is to extend that level of performance across the entire fleet, not just to those that have benefited from time and continuity.
A standardized approach to well barrier assurance is not a substitute for good rig culture. It is the mechanism that ensures good practice is applied consistently, regardless of where any individual rig sits on the performance curve.
Looking to improve BOP testing performance or strengthen your well barrier assurance processes? Contact IPT Global to implement a standardized, pressure testing and real-time monitoring framework across your offshore drilling fleet.
During a routine offshore BOP stump test, standard validation indicated acceptable results with no clear signs of failure. Pressure readings were stable, no alarms were triggered, and the system met conventional pass criteria.
However, traditional BOP pressure testing is designed to detect leaks, not subtle emerging issues. In this case, the system would likely have been cleared for deployment with an undetected integrity risk.
SureTec® PressureTesting TestEngine utilizing advanced leak detection analysis. Rather than relying solely on pass/fail thresholds, this approach evaluates:
This deeper analysis identified a subtle but consistent degradation in pressure trend; behavior inconsistent with a fully sealed system and easily overlooked using conventional methods.
Following the analysis:
By shifting the focus from “Did the test pass?” to “Does the data behave like a truly sealed system?”, the TestEngine analysis uncovered a developing leak that would have otherwise gone unnoticed. Early leak detection enabled proactive intervention, delivering measurable value:
This case reinforces a critical insight into traditional well control operations: passing a BOP pressure test does not guarantee system integrity. Subtle leaks can evade standard validation methods, progress under real operating conditions, and lead to high-impact offshore failures if left undetected.
By moving beyond pass/fail testing and understanding how pressure behaves over time, operators can detect what others miss, protecting both operations and the bottom line.
Some digital pressure testing methods used in the oil and gas industry rely on predictive early data trends to draw conclusions about future performance. While these approaches may appear sophisticated, they often depend on assumptions that can be misleading. In safety-critical operations, the consequences of being wrong can be very dangerous.
At IPT Global, our approach is grounded in physics: how equipment actually behaves under pressure and an array of thermal variables. Our SureTec® PressureTesting Solution focuses on measurable system behavior rather than early-time trends and predictions, which provides greater assurance, protecting people, assets, and the environment.
During well control equipment pressure testing, a pressure decline can result from three distinct causes:
Why is this a problem? Because all three occur at the same time, and their combined effects appear as a single pressure curve making interpretation more challenging than it first appears.
Many digital pressure testing tools attempt to determine a pass or fail by observing how pressure decline slows over time. However, thermal and elastic effects naturally dominate early behavior and always attenuate. This early stabilization can create the appearance of improvement even when a real leak is present.
In short, early-time prediction alone does not confirm integrity, but rather introduces uncertainty at precisely the point where certainty is required.
Rather than predicting what might happen, IPT Global’s PressureTesting Solution models how a leak-free system should behave. We account for normal pressure changes caused by temperature and equipment expansion, establish a physics-based fingerprint for a healthy system, and evaluate subsequent tests against that baseline to identify true integrity failures.
Our focus is on delivering accurate, objective digital pressure testing results. In practice, that means fewer assumptions and clearer answers during the test itself. Instead of relying on trend-based prediction, we ask a more fundamental question: Does the observed behavior match that of a leak-free system?
A major offshore operator evaluated IPT Global’s physics-based PressureTesting Solution against a competing predictive pressure testing solution using real subsea BOP test data, including tests with confirmed visible leaks.
IPT Global correctly identified every known failure. The predictive solution, however, incorrectly passed multiple tests, including some with confirmed visible leaks.
A false pass, indicating equipment integrity when a failure exists, can expose operations to safety risks, environmental damage, unplanned downtime, and reputational harm.
Ultimately, when people, assets, and the environment are on the line, uncertainty should never be mistaken for insight. Physics-based analysis replaces assumption with understanding and delivers the confidence that safety-critical decisions demand.
If we all had one magical wish, many of us would choose the ability to see into the future—pick the right lottery numbers, avoid costly mistakes, or prevent accidents before they happen. But we don’t have that luxury. We never have.
Yet in well control equipment pressure testing, the industry relies on methods that attempt to predict future outcomes based on early-time trends. That raises an important question: why would we base assurance of critical safety barriers on a guess?
During BOP and Well Barrier Element (WBE) pressure tests, pressure decline is driven by three distinct physical mechanisms:
Only one of these—the integrity failure—is the condition we are trying to detect. The other two are benign, expected behaviors.
Mathematically, the observed pressure change can be expressed as:
ΔPObserved = ΔPThermal + ΔPElastic Expansion + ΔPIntegrity Failure
Each mechanism produces a unique pressure signature. In real operations, these signatures are superimposed, producing the single pressure curve we observe during a test. Accurately interpreting that curve requires understanding—and accounting for—these physical effects, not overlooking them.
Predictive analysis methods attempt to assess whether pressure loss is attenuating toward a leak-free system. The flaw is fundamental: thermal and elastic effects always dominate early-time behavior, and they always attenuate.
As a result, predictive methods often interpret early attenuation as improvement—creating a false sense of confidence. In early pressure test time, predictive analysis is not insight; it is inference based on incomplete physics.
There is no crystal ball. Early-time pressure test prediction is, by definition, a guess.
IPT Global does not attempt to predict the future. Instead, our PressureTesting solution with Thermally Compensated Leak Detection (TCLD) applies physics-based algorithms to establish a leak-free fingerprint for a specific BOP test configuration.
That fingerprint reflects the expected thermal and elastic response of the system. Subsequent tests on similar systems are then evaluated against this baseline to identify true integrity failures—quickly, objectively, and without relying on trend prediction.
So which approach would you trust: a black-box predictive trend or physics grounded in real behavior?
A major offshore operator compiled a dataset of more than 20 subsea BOP pressure tests from actual operations. The dataset included confirmed leaking tests—some identified visually by rig crews—and was used to evaluate both IPT Global’s PressureTesting and a competing predictive digital pressure testing solution.
The results were unambiguous:
Read that again. Predictive analysis passed tests that had already failed in the field, some with confirmed visual leaks.
These were not marginal cases or subjective interpretations. They were verified integrity failures that predictive software missed entirely—the exact outcome digital pressure testing is meant to prevent.
This is not an isolated result. Time and again, IPT Global’s physics-based PressureTesting solution has demonstrated superior accuracy by grounding interpretation in measurable system behavior rather than early-time trend speculation.
When IPT Global issues a pressure test pass, you can trust that your well control equipment or well barrier element is performing as intended.
When IPT Global issues a fail, you know you’ve identified a real problem—before it becomes a larger one.
The cost of a false pass is not just deferred downtime. It is a risk to people, assets, the environment, and the reputation of the operation itself.
SureTec PressureTesting reveals true leak signatures efficiently and objectively by isolating the physical behaviors that matter. This is not forecasting. It is physics-based, mathematically rigorous, and proven in the field where real consequences exist.
In digital pressure testing of Well Barrier Elements and Well Control Equipment, uncertainty should never be mistaken for insight. Predictive methods rely on early-time trends dominated by thermal and elastic effects, creating the illusion of improvement that disappears in late time.
IPT Global’s PressureTesting solution removes this ambiguity by accounting for all contributors to pressure decay in your specific system from the beginning of the test. The result is earlier, more reliable decisions based on understanding and proof—not a guess.
IPT Global: Industry leaders in digital pressure test accuracy and well barrier assurance.
Subsea blowout preventer (BOP) soak testing is a long-standing part of pre-deployment programs. However, it remains one of the least consistently executed aspects of BOP control system evaluation. While teams perform the test routinely, they often overlook insight into stabilized pressure behavior.
Once a subsea BOP stack is deployed offshore, limited access significantly increases the cost of uncertainty. In 2023, IPT Global collaborated with Seadrill on an article published by Drilling Contractor examining the operational value of standardizing BOP soak testing and proposing a structured framework aligned with the American Petroleum Institute’s (API) Standard 53.
A subsea BOP soak test is a pressure stabilization procedure. Rigs perform it during pre-deployment testing to evaluate the integrity of the BOP control system under sustained pressure conditions. Unlike dynamic testing, soak testing allows pressures to stabilize and the system to settle into equilibrium.
During this stabilized period is when that behavior often emerges. Gradual pressure decay or inconsistent regulator response become apparent once transient effects dissipate. These conditions are not always obvious but can directly influence stack readiness and long-term system reliability.
Identifying these issues before deployment allows for investigation with limited operational impact. When teams do not identify these behaviors, they often surface during operations. At that stage, troubleshooting options are fewer and consequences are more costly.
Despite the importance of well control assurance, subsea BOP soak testing still varies across rigs, fleets, and regions. Common differences include test duration, applied pressure, acceptance criteria, and documentation practices.
In practice, this variability rarely reflects a lack of focus on safety. In IPT Global’s experience supporting pre-deployment testing, variability most often reflects legacy practices, differing OEM guidance, and misaligned acceptance thresholds. Over time, these inconsistencies make results difficult to compare and increase reliance on interpretation rather than data-driven evidence.
Standardizing subsea BOP soak testing does not mean removing operational judgment or imposing rigid procedures across all systems. Instead, it establishes a shared baseline that supports clearer execution and more consistent interpretation of results.
In the article, we discussed the operational value of more structured subsea BOP soak testing, aligned with API Standard 53. The intent was to reduce unnecessary variability while preserving flexibility across different BOP configurations.
Soak testing offers a rare opportunity to observe control system behavior once transient pressure effects have stabilized. When teams miss or inconsistently execute that opportunity, they overlook meaningful indicators of system health. API Standard 53 already serves as the foundation for subsea BOP equipment system requirements. Expanding guidance to clearly address soak testing would strengthen consistency while preserving flexibility across different system designs and operating environments.
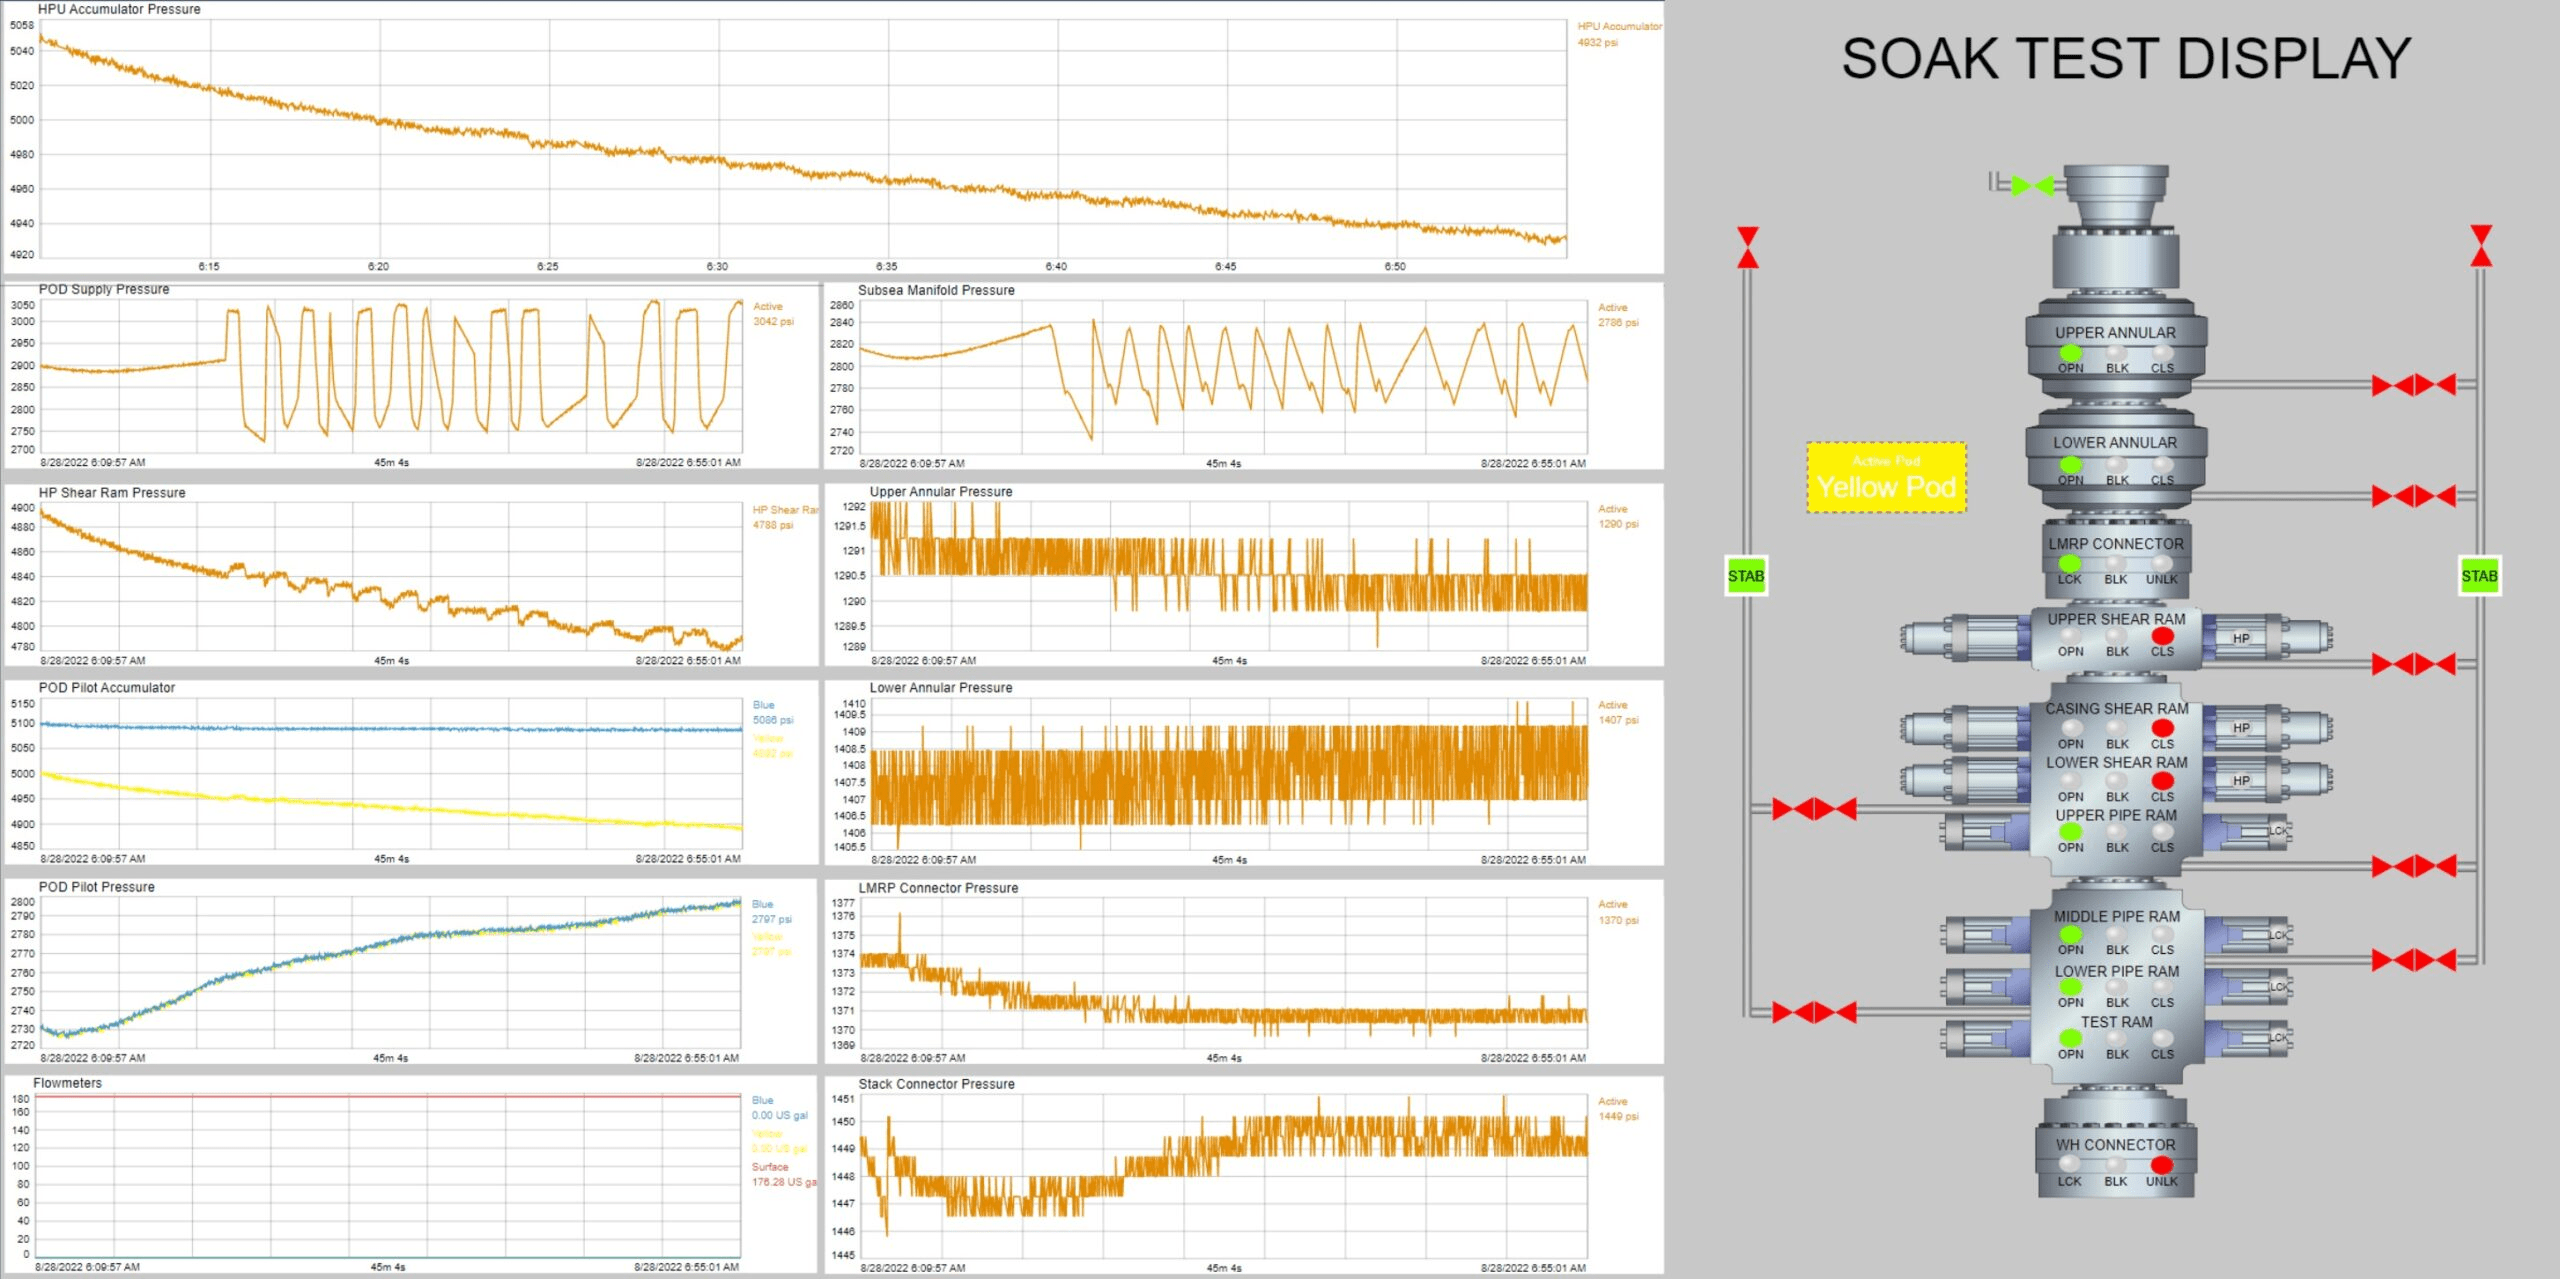
Digital pressure data enables teams to review stabilization trends directly, revealing gradual decay, irregular stabilization, and repeatable anomalies across tests.
With IPT Global’s Equipment Health Monitoring HealthAnalytics software and Monitoring service, digital diagnostics capture high-resolution pressure behavior during soak testing, enabling objective, contextual evaluation of subtle trends. Engineers in IPT Global’s Real-Time Operations Center (RTOC) monitor test data in real time and support decision-making during pre-deployment activities.
Together, our HealthAnalytics and Monitoring modules strengthen engineering judgment rather than replace it. Objective data provides a common reference point, improves alignment between operators, drilling contractors, and OEMs, and supports more confident decisions related to deployment readiness and pre-deployment assurance.
Subsea BOP soak testing delivers value through how teams evaluate results and act on them. Programs that consistently derive data-driven insight approach soak testing as part of a broader assurance process.
As subsea systems continue to increase in complexity, the ability to reduce uncertainty before deployment becomes increasingly important. Subsea BOP soak testing remains one of the few opportunities to observe control system behavior under stabilized pressure conditions.
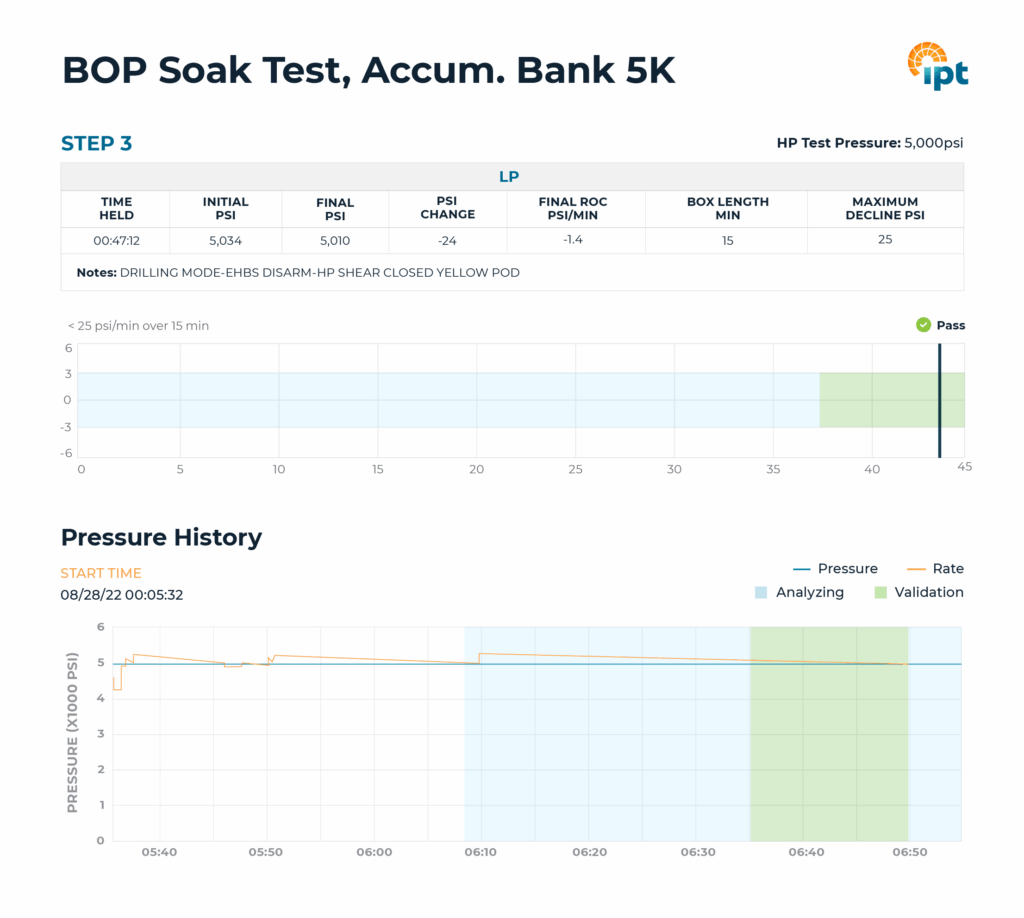
Through the SureTec® Equipment Health Monitoring solution, IPT Global applies a consistent, data-driven approach to subsea BOP soak testing during pre-deployment operations. By focusing on how control systems behave under stabilized pressure conditions, teams gain clearer insight into system performance before deployment decisions are made.
As subsea systems continue to grow in complexity, the way soak testing is executed and interpreted matters more than ever. Aligning practices with API Standard 53 provides a common framework for evaluating control system behavior, reducing unnecessary variability, and strengthening well control assurance across fleets. When teams pair that framework with objective pressure data and structured evaluation, soak testing becomes less about confirming pressure holds and more about understanding what the system is communicating before it goes offshore.
Looking ahead, IPT Global continues to advance digital software integrations that support consistent application of subsea BOP testing practices and ongoing improvement across the testing lifecycle.
For additional context, read the full article published in Drilling Contractor: Standardizing subsea BOP soak testing: overview of value and recommended best practices – Drilling Contractor by Patrick Hillard and Leonard Childers, IPT Global; and Ahmed Omar, Seadrill
When the operator introduced a new rig into the region, they quickly identified a performance gap in Blowout Preventer (BOP) testing. Rigs with several years of experience using IPT Global’s SureTec® PressureTesting solution consistently delivered faster and more reliable results. The new rig had not yet adopted the standardized digital pressure testing workflow required to achieve comparable performance.
The operator’s objective was to bring the new rig up to mature BOP testing performance as quickly as possible while maintaining verifiable well barrier integrity. Achieving this required shifting from variable manual processes to a consistent, documented digital pressure testing approach that reduced risk, minimized inefficiencies, and supported better operational decisions across the fleet.
IPT Global partnered with the operator to implement its PressureTesting solution, provide hands-on coaching, and establish standardized workflows. The result was a rapid improvement in safety and efficiency, with 210 documented pressure tests over the course of 14 months and significant reductions in critical path time early in the campaign.
Each well is unique, making direct comparisons in well barrier testing difficult. BOP testing provided the most practical benchmark because of its central role in safety and operational efficiency. The operator sought two outcomes: absolute confidence in barrier integrity and a reduction in high-pressure test times to minimize operational exposure and risk.
In addition, they wanted a consistent, documented pressure testing practice across the fleet, along with improved transparency between onshore support engineers and offshore execution teams. This was essential to minimize invisible lost communication time during a compressed drilling program.
IPT Global’s leading digital pressure testing software delivers accuracy, efficiency, and consistent assurance across every pressure test.
Adopting new technology requires the right expertise and support. IPT Global ensures customers maximize the value of our solutions through a unique blend of operational experience and data science. Our team combines direct rig experience with specialized software and analytics knowledge, applying technical excellence with practical execution.
IPT Global deployed field coaches to train crews in real operating conditions and ensure consistent, effective use of the software. Once training was complete, our 24/7 Real-Time Operations Center (RTOC) provided continuous support for planning, execution and oversight. IPT Global also supported the operator by embedding advisors within the wells team and providing real-time visibility across rigs, shore bases, and headquarters.
A key component of the solution was IPT Global’s PressureTesting TestPlanner module – a verification matrix developed alongside drilling engineers as they designed the test plan. TestPlanner provides assurance that every valve and component is tested to the correct pressure. Presented in a clear matrix format, it enables easy identification of optimization opportunities, such as removing unnecessary test steps and ensuring each barrier element is tested in the most efficient sequence.
All 210 pressure tests executed through the wells campaign were documented in standardized format, inclusive of all formation integrity tests (FIT) / Leak off tests (LOT), BOP tests, inflow tests, and completions testing.
Within the PressureTesting solution, pressure data can be captured from existing infrastructure such as cement units, IWOCS, or ROV systems and automatically integrated into the SureTec platform. The PressureTesting DigitalApprovals module removes the inefficiencies of chasing post-test wet signatures or waiting for email confirmations. Our RemoteView module bridges the gap between offshore execution and onshore approval, giving onshore teams real-time transparency into critical wellbore barrier verification. And with the ComplianceReporting module, each test is compiled into an auditable documentation report that can be shared with regulators and incorporated into end-of-well reporting.
A function that sets IPT Global’s SureTec platform apart is its WellSchematic solution, which provides the ability to generate wellbore and barrier schematics, providing offshore teams with clear, visual representations of the well configuration. For years, describing well configurations relied on complex plans and written instructions. IPT Global streamlines this by automatically importing data from industry-standard well planning software and offering drag-and-drop options. Through the BarrierManagement module, primary and secondary barriers can be assigned, making it easy to visualize which barrier envelope is being tested at each stage, reducing confusion and enhancing operational efficiency offshore.

Figure 1. Reduction in total BOP test duration across the campaign, from 14 hours to six hours achieved early and sustained through subsequent tests.
The most significant achievement was the reduction of the overall BOP test sequence from approximately 14 hours to just six hours, and this was achieved after only three BOP tests out of the 14 completed during the campaign. These improvements were driven by a combination of IPT Global’s technology, coaching, and the visual clarity provided by our software solutions.
At the core of this success was our Thermally Compensated Leak Detection, which reduced individual BOP test steps from 17 minutes to eight minutes, delivering more than a 50 percent saving per step. These gains were further supported by TestPlanner, which optimized test planning through our verification matrix, WellSchematic, and BarrierManagement, as well as efficiency improvements achieved through crew training and real-time operational support.
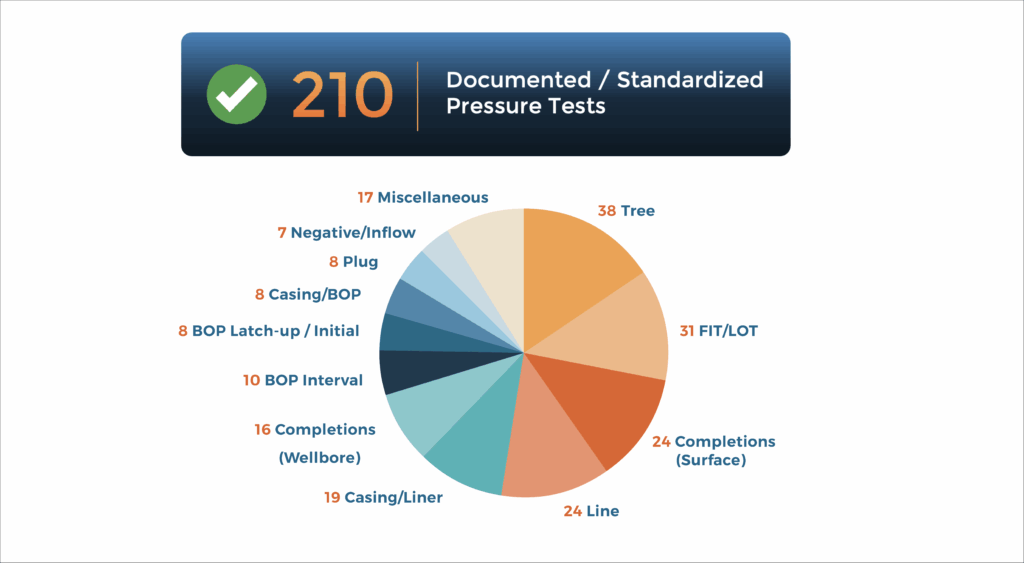
Figure 2. Breakdown of 210 documented pressure tests across the drilling and completion lifecycle, illustrating range of tests captured in standardized reports.
All tests were documented in easy-to-audit reports, ensuring compliance and transparency. While the time savings highlighted here focuses on BOP digital pressure testing, the campaign included 210 documented pressure tests covering the full cycle of drilling and completing these wells.
Importantly, IPT Global’s field coaches were removed from the rig after initial training, with the offshore crew fully supported remotely by our 24-7 Real-Time Operations Center (RTOC). This demonstrated that solution adoption and consistent high performance were embedded in the crew and sustained throughout the campaign.
IPT Global provides confidence in every test for every well by applying stringent in-house criteria, delivering faster results than traditional methods, and working collaboratively with customers to drive operational safety and efficiency. Our software ensures information flows seamlessly to the right people at the right time, while WellSchematic and BarrierManagement allow safe planning and execution ahead of operations. All of this is supported by real-time oversight from our RTOC.
Looking ahead, IPT Global will continue to advance well assurance intelligence and software integrations to make our solutions even more accessible and valuable for end users.
Managed Pressure Drilling (MPD) systems operate under demanding conditions, where small deviations in pressure or hydraulic behavior can escalate into equipment failure, unplanned non-productive time (NPT), and increased well control risk. Traditional well control equipment testing often depends on manual interpretation, delayed reporting, and limited visibility into early degradation trends.
In this analysis of MPD equipment failure, we examine how a major offshore operator used MPD control system data and IPT Global’s Equipment Health Monitoring solution to identify the deviation pattern that preceded a Slimline Annular (SLA) element failure. The analysis shows how automated MPD failure analysis and equipment health workflows can reveal early indicators of annular wear long before visible damage.
The operator experienced an unexpected failure of the Slimline Annular (SLA) element on the Integrated Rise Joint (IRJ) after less than two months of deployment and only 13 closures. During retrieval, the rig team discovered large pieces of degraded rubber in the trip tank and on top of the wear bushing.
The failure resulted in more than 250 hours of NPT. While the root cause was established through a lengthy investigation by the Original Equipment Manufacturer (OEM), the operator wanted to determine whether early indicators were present in the MPD control system data and if digital analysis could have detected the problem sooner.
This case raises two key questions for the operator:
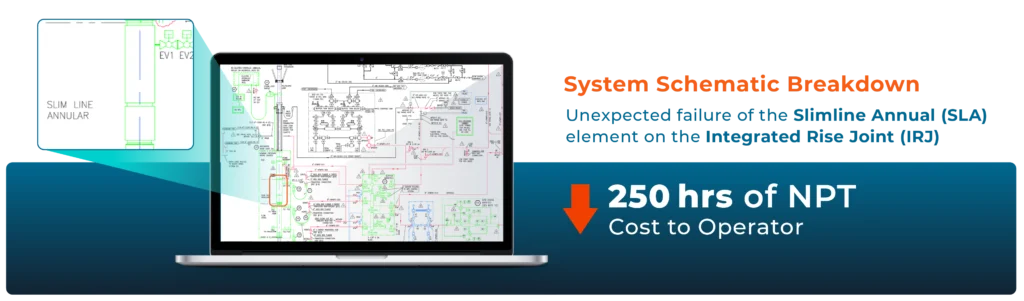
Figure 1. IPT Global’s MPD Equipment Health Monitoring dashboard enabled the operator to analyze annular pressure response trends and identify early signs of Slimline Annular (SLA) element degradation ahead of failure.
During a technology review, the operator approached IPT Global to evaluate whether digital real-time and MPD integrity management analytics could better support early detection of equipment degradation. They tested whether IPT Global’s Equipment Health Monitoring HealthAnalytics module could analyze MPD control data without context, manual tagging, or event descriptions.
To create a blind test, the operator provided a set of sanitized CSV files from the Transocean drillship MPD system; the files contained only raw time-series data from the SLA subsystem. Using this data set, IPT Global evaluated whether HealthAnalytics could pinpoint the failure window and detect the signal patterns that occurred beforehand.
IPT Global prepared the files, reformatted them, and ingested them into the Equipment Health Monitoring system. This software uses model-driven workflows designed for well control equipment testing, MPD failure analysis, and condition-based monitoring. It evaluates pressure response, hydraulic behavior, and closure performance to identify changes that indicate abnormal equipment performance or early-stage degradation.
Within minutes of data ingestion, the system flagged unusual pressure and hydraulic patterns inconsistent with expected annular behavior. IPT Global engineers ran multiple analysis modes over the next 48 to 72 hours to validate the signal patterns. Ultimately, the results consistently pointed to the same failure window later confirmed by the operator and the OEM.
Key outcomes
The analysis identified a distinct deviation in the annular element’s pressure and hydraulic response with progressive wear. Importantly, this pattern was detectable days before the failure became visible.
“With IPT Global’s Equipment Health Monitoring, we saw in two days what took months to uncover,” said the operator’s Senior Advisor of Rig Systems. “That’s the kind of insight that changes how you think about equipment monitoring.”
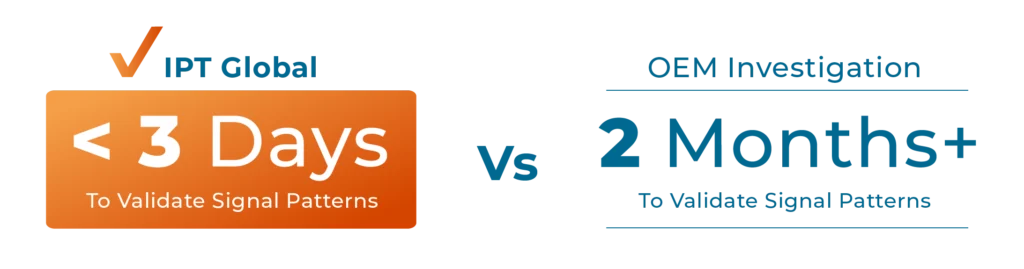
Figure 2. IPT Global’s MPD integrity workflows support proactive, data-driven condition monitoring that reduces NPT and improves equipment assurance.
This case demonstrates how digital MPD integrity management testing can improve operational reliability and reduce NPT. By tracking baseline trends and small deviations, operators can detect MPD equipment wear early and improve maintenance and risk decisions.
IPT Global continues to expand its condition-based monitoring and predictive analytics for MPD systems, strengthening well control readiness, accelerating fault detection, and supporting a more proactive approach to equipment assurance.
A wellbore diagram, or well schematic, provides a visual representation of the well and its components at any phase of the well life cycle. It can also serve as a valuable tool to aid in the planning and execution of well operations, from drilling and completions, to interventions and abandonment.
The detailed graphical information in wellbore schematics display the size (diameter) and length of major components and the depth at which the components are located.
Wellbore diagrams are a critical communication tool for all stakeholders and decision makers. Wellbore diagram programs should have key features like version control and collaboration capabilities to effectively handle risk management and change control. Wellbore schematics also need to be dynamic to track changes over the lifecycle of the well so that data is up-to-date and available on demand. IPT Global’s SureTec® WellSchematic solution is built around these needs, keeping schematics current and accessible across global operations teams.
The importance of wellbore diagrams cannot be overstated. Over the lifecycle of a well, wellbore diagrams are used for:
In the planning phase, operators and engineers utilize wellbore schematics to visualize design alternatives for the intended well. This aids in the safe and efficient delivery of both the well and the associated business objectives.
When integrated with drilling data acquisition software, wellbore diagrams can be used to communicate operational progress against the plan.
A wellbore diagram assists engineers in overseeing well barriers and assessing risks, as well as making informed decisions regarding the final positioning of casing strings, production tubing, and other completions equipment. It also influences decisions about future completions opportunities.
Coupled with actual well performance and production rate data, wellbore diagrams can help to identify potential production challenges and risks associated with well integrity issues.
Frequently updated wellbore diagrams streamline the decision-making process for well interventions and maintenance, serving as a valuable risk management tool to effectively handle well barrier management for interventions.
As a well reaches the end of its lifecycle, wellbore diagrams play a pivotal role in guiding the placement of cement plugs and other well barriers, ensuring the effective prevention of leaks and environmental contamination. This compliance with policy and regulatory requirements is essential, especially during the well abandonment or plug and abandonment process.
Wellbore diagrams differ in appearance but typically contain these components and symbols.
| Component | Description / Symbol |
|---|---|
| General information | Operator, lease name, well number, rig name, legal location, API number, latitude and longitude, date updated |
| Symbol: Displayed at top of schematic | |
| Elevation | Rotary Kelly Bushing (RKB), Mudline (ML), water depth |
| Symbol: Elevation value located at top of the schematic | |
| TD & PBTD | Total Depth of hole and Plugged Back Total Depth |
| Symbol: Values displayed at bottom of schematic | |
| Hole sections | Diameter, top of measured depth, and measured depth |
| Symbol: Vertical or horizontal dashed lines | |
| Casing | Size, weight, top measured depth (TMD), bottom measured depth (BMD), top of cement (TOC) |
| Symbol: Vertical lines representing different casing strings in the wellbore | |
| Cement | Top and bottom of cement, type of cement, yield and slurry weight |
| Symbol: A shaded area around the casing strings indicating the extent of cement placement | |
| Wellbore components | Packers, plugs, valves, tubing and gas mandrels |
| Symbol: A rectangle across the wellbore placed at a specific depth | |
| Completion components | Tubing hangers, gauges, production tubing, downhole safety valve, side pocket mandrel, slotted liner, landing nipple, etc. |
| Perforation depth | The location of perforations as defined by top measured depth (TMD) and bottom measured depth (BMD) |
| Symbol: Small, vertically aligned dots or short lines along the casing or tubing | |
| Liner | Size, weight, top measured depth (TMD), bottom measured depth (BMD), top of cement (TOC) |
| Symbol: Vertical lines inside the casing but not extending to the surface | |
| Lithology column | Vertical representation of formations encountered as the well is drilled |
| Symbol: Shading or patterns that distinguish one formation from another | |
| Formation tops | The upper boundary of geological formations |
| Symbol: A horizontal line with the name of the formation indicates the top boundary of a specific geological layer | |
| Geological symbols | Marks that represent geological features such as faults, unconformities, anticlines, and synclines |
| Symbol: A jagged or wavy line intersecting the wellbore trajectory | |
| Drilling fluid | Mud density, viscosity, formation pressures, temperature, etc. |
| Perforations | Top, bottom, shots per foot, and phasing angle |
| Symbol: open(green) and squeezed(red) | |
| Wellbore trajectory | Wellbore path from surface to target depth expressed in terms of measured depth, inclination and azimuth angles |
| Symbol: An arrow or curve along the wellbore trajectory shows the direction and angle of deviation during directional drilling |
 This is where your paragraph text goes. The text will now wrap perfectly around the left side of the right-aligned image because the image is coded inside the text block.
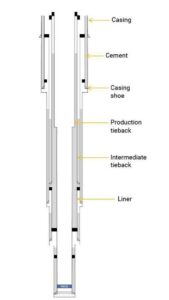
Casing provides structural support to the well and acts as a physical barrier to prevent fluid migration. The casing string consists of casing sections that decrease in diameter with depth. Casing setting points are adjusted to specific depths, for a particular hole diameter. The casing string is run into the wellbore and cemented into place to ensure proper zonal isolation and guarantee impermeable barrier between different formation zones. Casing is often represented in wellbore diagrams using vertical lines to denote different casing sections from the wellhead to the casing shoe. Liners are casing strings that normally run and set within the wellbore and typically do not extend all the way to the wellhead.
Cement is used to create a barrier between the wellbore and the surrounding rock formations. During well construction, the annular space between the casing and the formation is filled w
ith cement. The cement sheath forms a mechanical and hydraulic barrier, preventing fluid migration along the outside of the casing. Cement is depicted in wellbore diagrams by shaded areas that correspond to the depth range where the cement is placed.
A production tieback is typically connected to the top of the production liner or casing string that runs across the production reservoir interval. The primary purpose of a production tieback is to provide a conduit for the flow of hydrocarbons from the reservoir to the surface.
An intermediate tieback is used to isolate a casing string that cannot withstand possible pressure loads during drilling, usually because of excessive wear or higher higher-than than-anticipated pressures. In some cases, intermediate tiebacks may not connect directly to the top of a liner. Instead, they are typically set at a shallower depth and cemented separately from the production liner.
class=”alignright”
Subsurface formation boundaries and geological features can be accurately represented in wellbore diagrams to clearly indicate the geological formations encountered at various depths or hole sections. This helps drilling teams understand the lithology and potential reservoir characteristics.
Formations are separated by upper and lower boundaries where the rock lithology changes. Subsurface formation data, such as seismic surveys, core samples, and well logs help geologists, drilling engineers, and reservoir engineers accurately place the wellbore in the most favorable locations to optimize drilling efficiency, minimize drilling risks, and optimize future production.
Formation tops represent the upper boundaries of specific geological formation classifications, such as chalk, limestone, shale, and sandstone. They are typically marked with horizontal lines or notches
on the lithology column. Formation tops are labeled with the names of the formations they represent and provide valuable information about the depth at which the different formations are encountered.
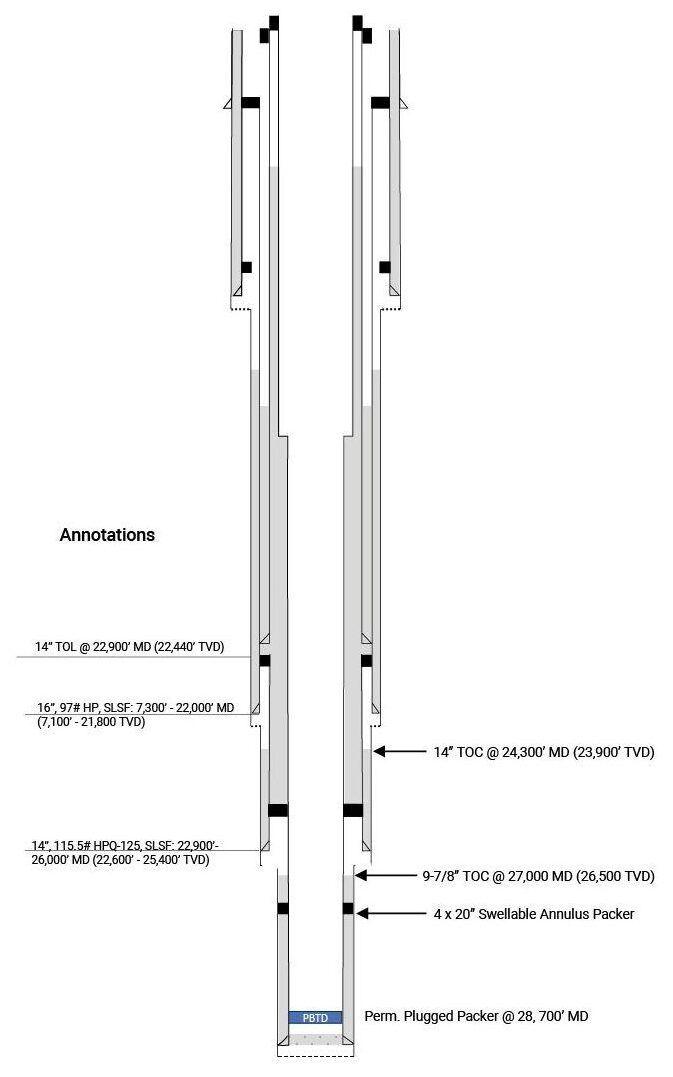
Annotations and labels provide additional information about the formations, features, and wellbore components. They can explain lithology and provide context for significant geological events, seismic characteristics, and more details about wellbore components.
A completions wellbore diagram is a visual representation of the components and configuration of the completions equipment within an oil or gas well. It provides a clear and comprehensive overview of how the well is equipped for production, including the arrangement of tubing, casing, packers, and other wellbore elements. It also serves as a detailed record of the completions design and completions equipment(jewelries) configuration for future reference, maintenance, and regulatory compliance. The completions diagram is typically accompanied by detailed annotations, specifications, and a legend to explain the symbols and components used. It serves as a critical reference document for well operators, production engineers, and maintenance teams throughout the well’s life cycle.
IPT Global’s WellSchematic solution and other software used to create wellbore schematics typically contain a range of features and functionalities designed to provide a comprehensive and detailed representation of the wellbore.
| Feature | Description |
|---|---|
| Wellbore visualization | Visual display of the wellbore |
| Casing and tubing strings | Generate casing and tubing sections or different sizes (diameter and thickness), depth, and cement sections |
| Deviations and doglegs | Ability to show any deviations or changes in trajectory during drilling |
| Formation tops | Geological data that indicate the depths of different formation tops encountered during drilling |
| Data integration | Integrates real time data from drilling operations such as weight on bit (WOB), rate of penetration (ROP), and rotary speed |
| Completion equipment | Production tubing, packers, plugs, and downhole valves |
| Easy editing | Allows users to modify the wellbore path and components |
| Scale and measurements | Tools to measure and modify distances in angles on the wellbore diagram |
| Survey data | Measure depth, inclination, azimuth, vertical section, northing, easting and readings at various depths |
| Exporting and reporting | Exporting the wellbore diagram in various formats for sharing with colleagues, regulatory authorities, or reports |
| Historical equipment tracking | Records changes to the well’s completion equipment over time |
| Version control | Documenting modifications to the wellbore as it progresses from drilling, completion and production to intervention, and abandonment |
| Geothermal information | Captures Surface Ambient Temperature, Seabed/Mudline Temperature and Formation Temperatures |
| Formation Input / Information | Comprises pore pressure data, fracture gradient data |
When using wellbore schematics software, accurate data entry, validation, and quality control are crucial to various aspects of safety, compliance, and overall well integrity. Inaccurate data entry can result in errors in well control decision-making, which increases safety risks to personnel, assets, and the environment. Erroneous data entries might result in redesigns, corrosion, collapses, or obstructions in the wellbore. For well operations that are subject to regulatory oversight, inaccurate wellbore schematics can lead to non-compliance, resulting in fines or other legal consequences. Inaccuracies could also lead to improper placement of critical wellbore elements, compromising the well’s structural integrity and potentially causing leaks or other problems of over the life of the well. Using wellbore management diagram software with built-in validation checks and data consistency features can help reduce the risk of errors and assist in diagnostics if integrity or production issues arise.
As a well progresses from planning to drilling, completion, production, and abandonment, various wellbore modifications occur. It’s important to keep the wellbore diagram schematic up to date to reflect the specific state and configuration of the well at a given point in time, as well as store all changes that have taken place. Version control is fundamental to change-management processes.
Version control, or versioning, is the practice of documenting changes to wellbore diagrams over a well’s lifecycle to accurately reflect modifications during drilling, completion, workovers, interventions, and abandonment. Each version of the wellbore diagram reflects the specific state and configuration of the well at a given point in time, carrying significant implications for decision-making, regulatory adherence, troubleshooting, and collaboration. This becomes particularly crucial as the responsibility for the well transitions from one department to another throughout its lifespan. Incorporating well-defined approval signatories and technical authorities into the process is an essential requirement for ensuring well integrity.
Wellbore diagram applications have different forms of version control with the goal of a single source of truth. Some applications have project management features that enable users to track versions of wellbore diagrams while other applications may simply record edits and modifications made to a wellbore diagram. Other applications not only store previous wellbore diagram versions but also alert all relevant users when changes are made to a wellbore diagram so they can update it in their local repository.
Wellbore diagrams are indispensable tools in the oil and gas industry, contributing to the efficient and safe operation of wells. Their role in visualizing, documenting, and communicating wellbore information underscores their importance in every aspect of well management. To ensure successful well operations, it is crucial to adopt wellbore diagram software that makes creating wellbore diagrams easy and maintains data accuracy and version control. Contact us for information about IPT Global’s Wellbore Schematic Tool.
To learn how IPT Global’s WellSchematic solution—with barrier diagrams—can support your wellbore schematic needs, contact us today.