
Well barrier management — the process behind the design, implementation, and maintenance of barriers — is an essential part of any successful drilling operation. The more effective a well barrier is, the longer a well can operate unimpeded.
IPT Global showcased SureTec® WellSchematic, a cloud-based solution that simplifies wellbore schematic creation and barrier diagram generation, at the 2026 IADC/SPE International Drilling Conference in Galveston, Texas. It integrates visualizations, testing data, and collaborative processes into one solution, allowing users to visualize the full barrier envelope in real time.
In this video interview with Drilling Contractor Magazine on March 17, Cody MacDonald, Chief Technology Officer at IPT Global, discussed the insights that the software can provide.
When the operator introduced a new rig into the region, they quickly identified a performance gap in Blowout Preventer (BOP) testing. Rigs with several years of experience using IPT Global’s SureTec® PressureTesting solution consistently delivered faster and more reliable results. The new rig had not yet adopted the standardized digital pressure testing workflow required to achieve comparable performance.
The operator’s objective was to bring the new rig up to mature BOP testing performance as quickly as possible while maintaining verifiable well barrier integrity. Achieving this required shifting from variable manual processes to a consistent, documented digital pressure testing approach that reduced risk, minimized inefficiencies, and supported better operational decisions across the fleet.
IPT Global partnered with the operator to implement its PressureTesting solution, provide hands-on coaching, and establish standardized workflows. The result was a rapid improvement in safety and efficiency, with 210 documented pressure tests over the course of 14 months and significant reductions in critical path time early in the campaign.
Each well is unique, making direct comparisons in well barrier testing difficult. BOP testing provided the most practical benchmark because of its central role in safety and operational efficiency. The operator sought two outcomes: absolute confidence in barrier integrity and a reduction in high-pressure test times to minimize operational exposure and risk.
In addition, they wanted a consistent, documented pressure testing practice across the fleet, along with improved transparency between onshore support engineers and offshore execution teams. This was essential to minimize invisible lost communication time during a compressed drilling program.
IPT Global’s leading digital pressure testing software delivers accuracy, efficiency, and consistent assurance across every pressure test.
Adopting new technology requires the right expertise and support. IPT Global ensures customers maximize the value of our solutions through a unique blend of operational experience and data science. Our team combines direct rig experience with specialized software and analytics knowledge, applying technical excellence with practical execution.
IPT Global deployed field coaches to train crews in real operating conditions and ensure consistent, effective use of the software. Once training was complete, our 24/7 Real-Time Operations Center (RTOC) provided continuous support for planning, execution and oversight. IPT Global also supported the operator by embedding advisors within the wells team and providing real-time visibility across rigs, shore bases, and headquarters.
A key component of the solution was IPT Global’s PressureTesting TestPlanner module – a verification matrix developed alongside drilling engineers as they designed the test plan. TestPlanner provides assurance that every valve and component is tested to the correct pressure. Presented in a clear matrix format, it enables easy identification of optimization opportunities, such as removing unnecessary test steps and ensuring each barrier element is tested in the most efficient sequence.
All 210 pressure tests executed through the wells campaign were documented in standardized format, inclusive of all formation integrity tests (FIT) / Leak off tests (LOT), BOP tests, inflow tests, and completions testing.
Within the PressureTesting solution, pressure data can be captured from existing infrastructure such as cement units, IWOCS, or ROV systems and automatically integrated into the SureTec platform. The PressureTesting DigitalApprovals module removes the inefficiencies of chasing post-test wet signatures or waiting for email confirmations. Our RemoteView module bridges the gap between offshore execution and onshore approval, giving onshore teams real-time transparency into critical wellbore barrier verification. And with the ComplianceReporting module, each test is compiled into an auditable documentation report that can be shared with regulators and incorporated into end-of-well reporting.
A function that sets IPT Global’s SureTec platform apart is its WellSchematic solution, which provides the ability to generate wellbore and barrier schematics, providing offshore teams with clear, visual representations of the well configuration. For years, describing well configurations relied on complex plans and written instructions. IPT Global streamlines this by automatically importing data from industry-standard well planning software and offering drag-and-drop options. Through the BarrierManagement module, primary and secondary barriers can be assigned, making it easy to visualize which barrier envelope is being tested at each stage, reducing confusion and enhancing operational efficiency offshore.

Figure 1. Reduction in total BOP test duration across the campaign, from 14 hours to six hours achieved early and sustained through subsequent tests.
The most significant achievement was the reduction of the overall BOP test sequence from approximately 14 hours to just six hours, and this was achieved after only three BOP tests out of the 14 completed during the campaign. These improvements were driven by a combination of IPT Global’s technology, coaching, and the visual clarity provided by our software solutions.
At the core of this success was our Thermally Compensated Leak Detection, which reduced individual BOP test steps from 17 minutes to eight minutes, delivering more than a 50 percent saving per step. These gains were further supported by TestPlanner, which optimized test planning through our verification matrix, WellSchematic, and BarrierManagement, as well as efficiency improvements achieved through crew training and real-time operational support.
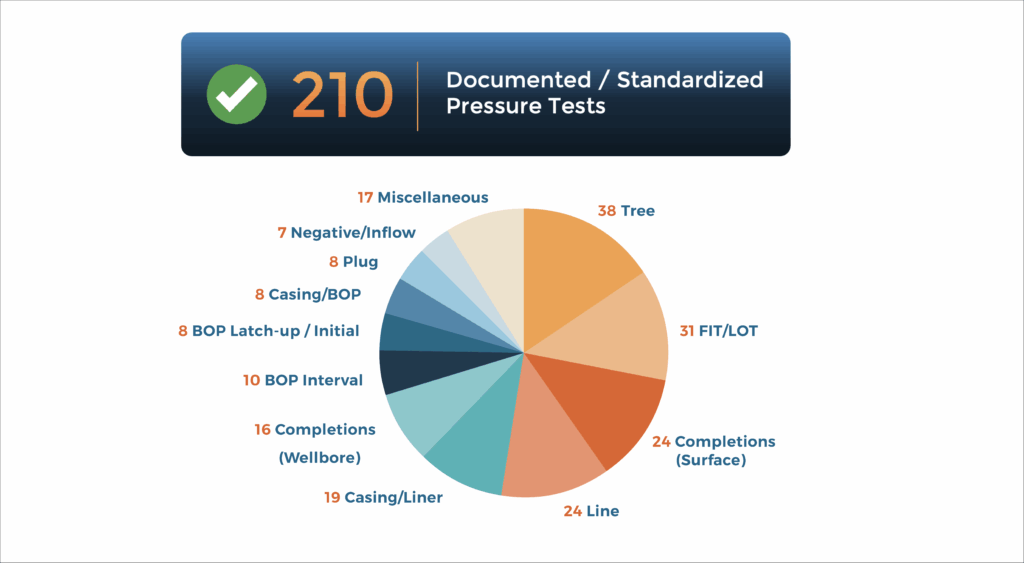
Figure 2. Breakdown of 210 documented pressure tests across the drilling and completion lifecycle, illustrating range of tests captured in standardized reports.
All tests were documented in easy-to-audit reports, ensuring compliance and transparency. While the time savings highlighted here focuses on BOP digital pressure testing, the campaign included 210 documented pressure tests covering the full cycle of drilling and completing these wells.
Importantly, IPT Global’s field coaches were removed from the rig after initial training, with the offshore crew fully supported remotely by our 24-7 Real-Time Operations Center (RTOC). This demonstrated that solution adoption and consistent high performance were embedded in the crew and sustained throughout the campaign.
IPT Global provides confidence in every test for every well by applying stringent in-house criteria, delivering faster results than traditional methods, and working collaboratively with customers to drive operational safety and efficiency. Our software ensures information flows seamlessly to the right people at the right time, while WellSchematic and BarrierManagement allow safe planning and execution ahead of operations. All of this is supported by real-time oversight from our RTOC.
Looking ahead, IPT Global will continue to advance well assurance intelligence and software integrations to make our solutions even more accessible and valuable for end users.
A wellbore diagram, or well schematic, provides a visual representation of the well and its components at any phase of the well life cycle. It can also serve as a valuable tool to aid in the planning and execution of well operations, from drilling and completions, to interventions and abandonment.
The detailed graphical information in wellbore schematics display the size (diameter) and length of major components and the depth at which the components are located.
Wellbore diagrams are a critical communication tool for all stakeholders and decision makers. Wellbore diagram programs should have key features like version control and collaboration capabilities to effectively handle risk management and change control. Wellbore schematics also need to be dynamic to track changes over the lifecycle of the well so that data is up-to-date and available on demand. IPT Global’s SureTec® WellSchematic solution is built around these needs, keeping schematics current and accessible across global operations teams.
The importance of wellbore diagrams cannot be overstated. Over the lifecycle of a well, wellbore diagrams are used for:
In the planning phase, operators and engineers utilize wellbore schematics to visualize design alternatives for the intended well. This aids in the safe and efficient delivery of both the well and the associated business objectives.
When integrated with drilling data acquisition software, wellbore diagrams can be used to communicate operational progress against the plan.
A wellbore diagram assists engineers in overseeing well barriers and assessing risks, as well as making informed decisions regarding the final positioning of casing strings, production tubing, and other completions equipment. It also influences decisions about future completions opportunities.
Coupled with actual well performance and production rate data, wellbore diagrams can help to identify potential production challenges and risks associated with well integrity issues.
Frequently updated wellbore diagrams streamline the decision-making process for well interventions and maintenance, serving as a valuable risk management tool to effectively handle well barrier management for interventions.
As a well reaches the end of its lifecycle, wellbore diagrams play a pivotal role in guiding the placement of cement plugs and other well barriers, ensuring the effective prevention of leaks and environmental contamination. This compliance with policy and regulatory requirements is essential, especially during the well abandonment or plug and abandonment process.
Wellbore diagrams differ in appearance but typically contain these components and symbols.
| Component | Description / Symbol |
|---|---|
| General information | Operator, lease name, well number, rig name, legal location, API number, latitude and longitude, date updated |
| Symbol: Displayed at top of schematic | |
| Elevation | Rotary Kelly Bushing (RKB), Mudline (ML), water depth |
| Symbol: Elevation value located at top of the schematic | |
| TD & PBTD | Total Depth of hole and Plugged Back Total Depth |
| Symbol: Values displayed at bottom of schematic | |
| Hole sections | Diameter, top of measured depth, and measured depth |
| Symbol: Vertical or horizontal dashed lines | |
| Casing | Size, weight, top measured depth (TMD), bottom measured depth (BMD), top of cement (TOC) |
| Symbol: Vertical lines representing different casing strings in the wellbore | |
| Cement | Top and bottom of cement, type of cement, yield and slurry weight |
| Symbol: A shaded area around the casing strings indicating the extent of cement placement | |
| Wellbore components | Packers, plugs, valves, tubing and gas mandrels |
| Symbol: A rectangle across the wellbore placed at a specific depth | |
| Completion components | Tubing hangers, gauges, production tubing, downhole safety valve, side pocket mandrel, slotted liner, landing nipple, etc. |
| Perforation depth | The location of perforations as defined by top measured depth (TMD) and bottom measured depth (BMD) |
| Symbol: Small, vertically aligned dots or short lines along the casing or tubing | |
| Liner | Size, weight, top measured depth (TMD), bottom measured depth (BMD), top of cement (TOC) |
| Symbol: Vertical lines inside the casing but not extending to the surface | |
| Lithology column | Vertical representation of formations encountered as the well is drilled |
| Symbol: Shading or patterns that distinguish one formation from another | |
| Formation tops | The upper boundary of geological formations |
| Symbol: A horizontal line with the name of the formation indicates the top boundary of a specific geological layer | |
| Geological symbols | Marks that represent geological features such as faults, unconformities, anticlines, and synclines |
| Symbol: A jagged or wavy line intersecting the wellbore trajectory | |
| Drilling fluid | Mud density, viscosity, formation pressures, temperature, etc. |
| Perforations | Top, bottom, shots per foot, and phasing angle |
| Symbol: open(green) and squeezed(red) | |
| Wellbore trajectory | Wellbore path from surface to target depth expressed in terms of measured depth, inclination and azimuth angles |
| Symbol: An arrow or curve along the wellbore trajectory shows the direction and angle of deviation during directional drilling |
 This is where your paragraph text goes. The text will now wrap perfectly around the left side of the right-aligned image because the image is coded inside the text block.
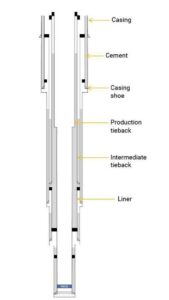
Casing provides structural support to the well and acts as a physical barrier to prevent fluid migration. The casing string consists of casing sections that decrease in diameter with depth. Casing setting points are adjusted to specific depths, for a particular hole diameter. The casing string is run into the wellbore and cemented into place to ensure proper zonal isolation and guarantee impermeable barrier between different formation zones. Casing is often represented in wellbore diagrams using vertical lines to denote different casing sections from the wellhead to the casing shoe. Liners are casing strings that normally run and set within the wellbore and typically do not extend all the way to the wellhead.
Cement is used to create a barrier between the wellbore and the surrounding rock formations. During well construction, the annular space between the casing and the formation is filled w
ith cement. The cement sheath forms a mechanical and hydraulic barrier, preventing fluid migration along the outside of the casing. Cement is depicted in wellbore diagrams by shaded areas that correspond to the depth range where the cement is placed.
A production tieback is typically connected to the top of the production liner or casing string that runs across the production reservoir interval. The primary purpose of a production tieback is to provide a conduit for the flow of hydrocarbons from the reservoir to the surface.
An intermediate tieback is used to isolate a casing string that cannot withstand possible pressure loads during drilling, usually because of excessive wear or higher higher-than than-anticipated pressures. In some cases, intermediate tiebacks may not connect directly to the top of a liner. Instead, they are typically set at a shallower depth and cemented separately from the production liner.
class=”alignright”
Subsurface formation boundaries and geological features can be accurately represented in wellbore diagrams to clearly indicate the geological formations encountered at various depths or hole sections. This helps drilling teams understand the lithology and potential reservoir characteristics.
Formations are separated by upper and lower boundaries where the rock lithology changes. Subsurface formation data, such as seismic surveys, core samples, and well logs help geologists, drilling engineers, and reservoir engineers accurately place the wellbore in the most favorable locations to optimize drilling efficiency, minimize drilling risks, and optimize future production.
Formation tops represent the upper boundaries of specific geological formation classifications, such as chalk, limestone, shale, and sandstone. They are typically marked with horizontal lines or notches
on the lithology column. Formation tops are labeled with the names of the formations they represent and provide valuable information about the depth at which the different formations are encountered.
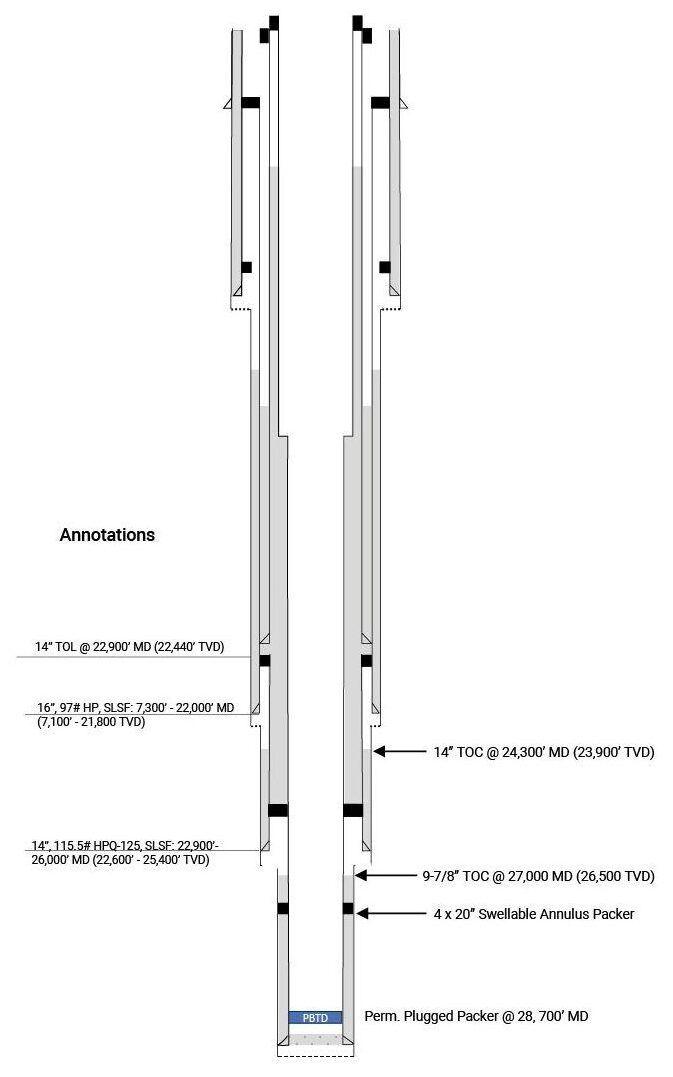
Annotations and labels provide additional information about the formations, features, and wellbore components. They can explain lithology and provide context for significant geological events, seismic characteristics, and more details about wellbore components.
A completions wellbore diagram is a visual representation of the components and configuration of the completions equipment within an oil or gas well. It provides a clear and comprehensive overview of how the well is equipped for production, including the arrangement of tubing, casing, packers, and other wellbore elements. It also serves as a detailed record of the completions design and completions equipment(jewelries) configuration for future reference, maintenance, and regulatory compliance. The completions diagram is typically accompanied by detailed annotations, specifications, and a legend to explain the symbols and components used. It serves as a critical reference document for well operators, production engineers, and maintenance teams throughout the well’s life cycle.
IPT Global’s WellSchematic solution and other software used to create wellbore schematics typically contain a range of features and functionalities designed to provide a comprehensive and detailed representation of the wellbore.
| Feature | Description |
|---|---|
| Wellbore visualization | Visual display of the wellbore |
| Casing and tubing strings | Generate casing and tubing sections or different sizes (diameter and thickness), depth, and cement sections |
| Deviations and doglegs | Ability to show any deviations or changes in trajectory during drilling |
| Formation tops | Geological data that indicate the depths of different formation tops encountered during drilling |
| Data integration | Integrates real time data from drilling operations such as weight on bit (WOB), rate of penetration (ROP), and rotary speed |
| Completion equipment | Production tubing, packers, plugs, and downhole valves |
| Easy editing | Allows users to modify the wellbore path and components |
| Scale and measurements | Tools to measure and modify distances in angles on the wellbore diagram |
| Survey data | Measure depth, inclination, azimuth, vertical section, northing, easting and readings at various depths |
| Exporting and reporting | Exporting the wellbore diagram in various formats for sharing with colleagues, regulatory authorities, or reports |
| Historical equipment tracking | Records changes to the well’s completion equipment over time |
| Version control | Documenting modifications to the wellbore as it progresses from drilling, completion and production to intervention, and abandonment |
| Geothermal information | Captures Surface Ambient Temperature, Seabed/Mudline Temperature and Formation Temperatures |
| Formation Input / Information | Comprises pore pressure data, fracture gradient data |
When using wellbore schematics software, accurate data entry, validation, and quality control are crucial to various aspects of safety, compliance, and overall well integrity. Inaccurate data entry can result in errors in well control decision-making, which increases safety risks to personnel, assets, and the environment. Erroneous data entries might result in redesigns, corrosion, collapses, or obstructions in the wellbore. For well operations that are subject to regulatory oversight, inaccurate wellbore schematics can lead to non-compliance, resulting in fines or other legal consequences. Inaccuracies could also lead to improper placement of critical wellbore elements, compromising the well’s structural integrity and potentially causing leaks or other problems of over the life of the well. Using wellbore management diagram software with built-in validation checks and data consistency features can help reduce the risk of errors and assist in diagnostics if integrity or production issues arise.
As a well progresses from planning to drilling, completion, production, and abandonment, various wellbore modifications occur. It’s important to keep the wellbore diagram schematic up to date to reflect the specific state and configuration of the well at a given point in time, as well as store all changes that have taken place. Version control is fundamental to change-management processes.
Version control, or versioning, is the practice of documenting changes to wellbore diagrams over a well’s lifecycle to accurately reflect modifications during drilling, completion, workovers, interventions, and abandonment. Each version of the wellbore diagram reflects the specific state and configuration of the well at a given point in time, carrying significant implications for decision-making, regulatory adherence, troubleshooting, and collaboration. This becomes particularly crucial as the responsibility for the well transitions from one department to another throughout its lifespan. Incorporating well-defined approval signatories and technical authorities into the process is an essential requirement for ensuring well integrity.
Wellbore diagram applications have different forms of version control with the goal of a single source of truth. Some applications have project management features that enable users to track versions of wellbore diagrams while other applications may simply record edits and modifications made to a wellbore diagram. Other applications not only store previous wellbore diagram versions but also alert all relevant users when changes are made to a wellbore diagram so they can update it in their local repository.
Wellbore diagrams are indispensable tools in the oil and gas industry, contributing to the efficient and safe operation of wells. Their role in visualizing, documenting, and communicating wellbore information underscores their importance in every aspect of well management. To ensure successful well operations, it is crucial to adopt wellbore diagram software that makes creating wellbore diagrams easy and maintains data accuracy and version control. Contact us for information about IPT Global’s Wellbore Schematic Tool.
To learn how IPT Global’s WellSchematic solution—with barrier diagrams—can support your wellbore schematic needs, contact us today.
IPT Global partnered with a major global operator to standardize and optimize fleet-wide BOP testing. This collaborative initiative resulted in over 33 days or 800 hours of deepwater rig time savings per annum for the customer. In addition to creating value through gained efficiencies, IPT Global continues to protect value for this client through enhanced assurance of well barrier integrity across their operations.
Prior to this fleet-wide initiative, the operator did not have a standard approach to BOP testing. Operations varied across regions using a combination of SureTec PressureTesting, circular chart recorders, and competitor digital chart solutions. This was an opportunity to ensure effective implementation of process safety policies and to drive efficiency across global operations.
IPT Global’s performance advisor partnered with the client’s teams to ensure accelerated learning by utilizing big data and analytics that made performance visible and transparent. Implementation of IPT Global’s PressureTesting solution fleetwide increased efficiencies in regions where inferior solutions were previously used. Adoption of one standardized digital solution allowed for consistent assurance practices to meet internal requirements, compliance with regulatory requirements, and remove sources of human error from operations.
During test design and planning, all test plans were created and optimized using PressureTesting’s TestPlanner module to ensure compliance and consistency with company policy and regulations. IPT Global’s SMEs generated and optimized test plans based on decades of experience across multiple global operators. A wholesale reduction of three to four test steps per test resulted in reduced component wear and tear, extending mean- time between failures while reducing maintenance and operational time and costs across the fleet.
In addition to test step reduction and optimization, deepwater projects that adopted the PressureTesting digital solution benefited from over 25% time savings per test with IPT Global’s advanced algorithms. Algorithms that are not only fast and efficient, but stringent and rigorous as well, providing industry-leading assurance that all leaks are detected early.
After global implementation of SureTec PressureTesting, all of the regional operations were fully documented in standardized reports and archived in IPT Global’s cloud-based collaboration hub. IPT Global’s performance advisor consulted with the client teams to define custom performance metrics and KPIs to track within PressureTesting. Once this information was transparent across the fleet, the team was able to identify opportunities for performance and process improvements and to share key learnings.
Through a collaborative and trusted partnership, the fleet-wide implementation of SureTec PressureTesting resulted in more than 800 hours, or 33 days, of critical path time savings per year for BOP testing. This was achieved through a global initiative to consult with IPT Global SMEs, who identified opportunities to reduce waste in test plans by eliminating steps; and by implementing the most efficient and robust digital solution for well barrier verification.
IPT Global’s performance advisor was able to provide a holistic perspective across the operations to share best practices, and identify accelerated learning opportunities that improved overall operational efficiency. Applying PressureTestingas a global digital solution was a critical step towards removing sources of human error from operations and to ensure that all regions were following standard practices and procedures.