
Condition-Based Maintenance (CBM) is preventive maintenance performed at a frequency based on the assessment of the actual physical condition of components or assemblies. CBM provides an alternative to schedule-based maintenance frequencies, which are commonly used for BOPs. CBM can reduce the risk of equipment failure by triggering maintenance earlier than would be performed by a standard schedule, if necessary. CBM can further reduce risk and lower overall maintenance costs by eliminating unnecessary preventive maintenance. The need for CBM is discovered using IPT’s proprietary algorithm that detects, extracts, and analyzes real-time operational and performance data from the rig. This data is displayed on IPT’s SureView dashboard. IPT’s team uses the data to implement a condition-based maintenance program.
Subsea blowout preventers (BOPs) attach to the wellhead and serve as an important barrier element that prevents formation fluids and gases from flowing uncontrolled to the rig floor and causing a kick or blowout. BOPs consist of redundant control pods and electronically and hydraulically powered components such as hydraulic connectors, upper and lower annular preventers, casing and blind shear rams, and pipe rams. BOP accumulators provide sufficient pressure to operate these components when hydraulic and electric connectivity has been interrupted. BOP components must be periodically tested to ensure proper operation in an emergency.
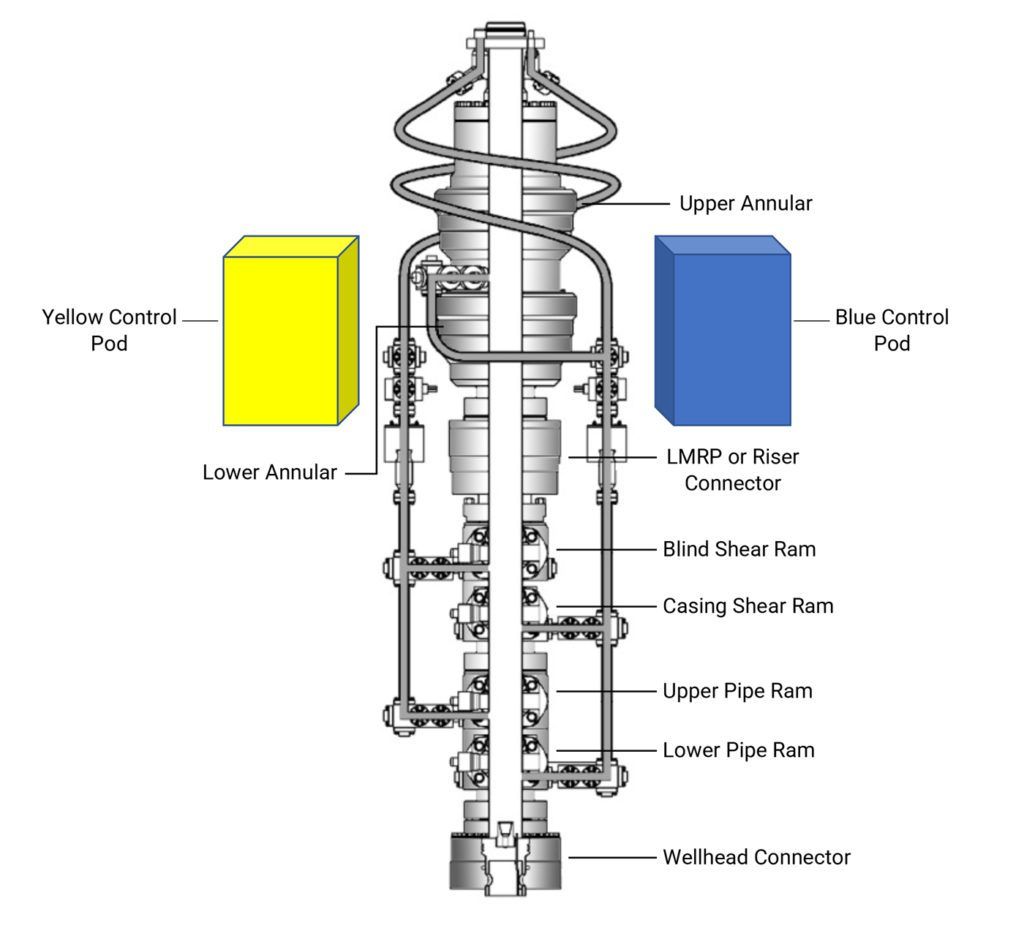
Operators must periodically pressure test and function test BOP stack components, which decreases efficiency of drilling operations. BOP pressure tests are performed at regular intervals typically ranging from 14 to 30 days as set by local regulatory bodies. A single BOP pressure test consists of several steps that are performed at low or high pressure to detect a leak in the piping, manifold, or BOP components. Each step involves isolating a system, pressurizing it, shutting it in, and analyzing the pressure change. BOP stack components may be pressure tested a dozen times or more during drilling operations for a single well. The total time for each complete BOP pressure test may take from 12 to 24 hours and increase the length of operations significantly.
BOPs components must also be function tested weekly by actuating (opening and closing) the annular preventers and rams to ensure they will operate properly in an emergency. Function tests are designed to monitor the time (seconds) and volume of fluid (gallons) it takes to actuate individual components, which are important parameters for CBM. The test procedure may vary by rig, but typically, a member of the subsea crew opens or closes individual BOP components from the control panel and manually records the actuation duration and fluid volume from analog or digital gauges.
The actuation duration and the volume of fluid are important indicators of the health of critical BOP components. If test measurements are analyzed over time along with equipment maintenance and failure tracking, the data can be used to spots trends that identify needed maintenance or indicate the imminent failure of a critical component.
The challenge is to analyze BOP test, maintenance, and failure data analyses so that operators can gain insight into when and why failures are happening. This will allow contractors to perform maintenance on BOP components when necessary, rather than on an arbitrary schedule as is commonly used.
IPT developed an automated physics-based algorithm that detects and extracts function test data from the real-time data on the rig in real time. IPT’s team of well control and BOP SMEs assisted with the algorithms development to ensure that the function test data are detected correctly, objectively, and consistently. The algorithms can detect parameters such as an increase in test duration, unusual hydraulic fluid flow volumes, or specific regulator pressure signatures. This information is extracted for all function tests performed and displayed on IPT’s analytics web app, SureView.
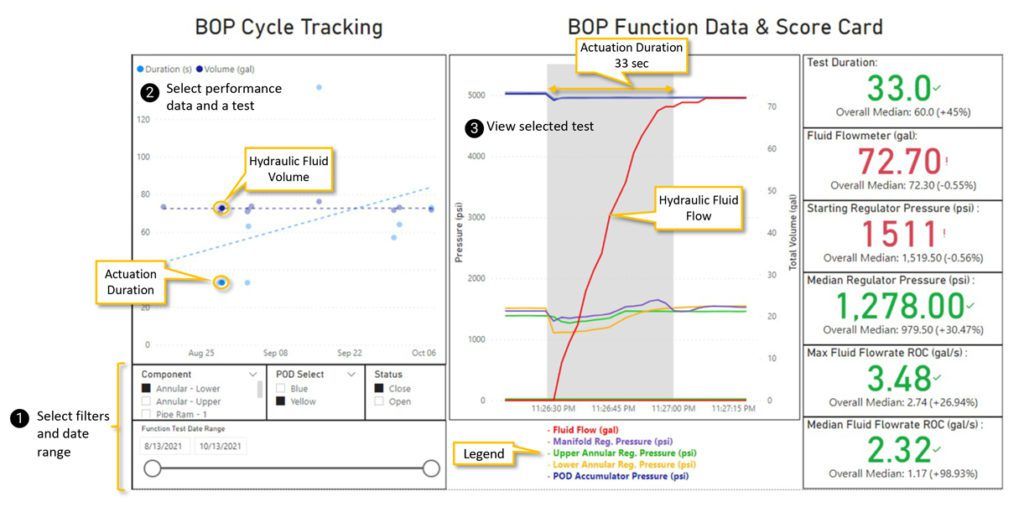
The figure below is a screenshot of IPT’s SureView dashboard for reviewing performance and function test data extracted by the algorithm. The steps to use the SureView dashboard are as follows:
The Function Test Data chart below shows that after the signal to close was initiated, the fluid flow steeply increased, and the valve started to actuate. The upper and lower annular regulator pressure dropped quickly and then returned gradually to their starting pressure. The Score Card shows that the function test compared well to other tests results because four values (in green) were better than their respective median values and two values (in red) were slightly above their median values.
The next screenshot is an example of a function test that did not perform as well compared to other tests. Using the same filters as the previous example, the user selected the largest outlier in the BOP Cycle Tracking chart. The Score Card quickly shows that five parameters were worse than their median values. The Test Duration is more than twice the median value. The Median Regulator Pressure and Max Fluid Flowrate ROC are significantly less than their median values.
The BOP Function Data chart shows the details behind the values in the Score Card. The Regulator Pressure quickly declined and stayed low until it finally recovered to its initial levels over two minutes later. The Fluid Flow shows a slower rate compared to previous tests, less than half of our previous test. Both of these factors contributed to the longer test duration and can be used in failure analysis and investigation.
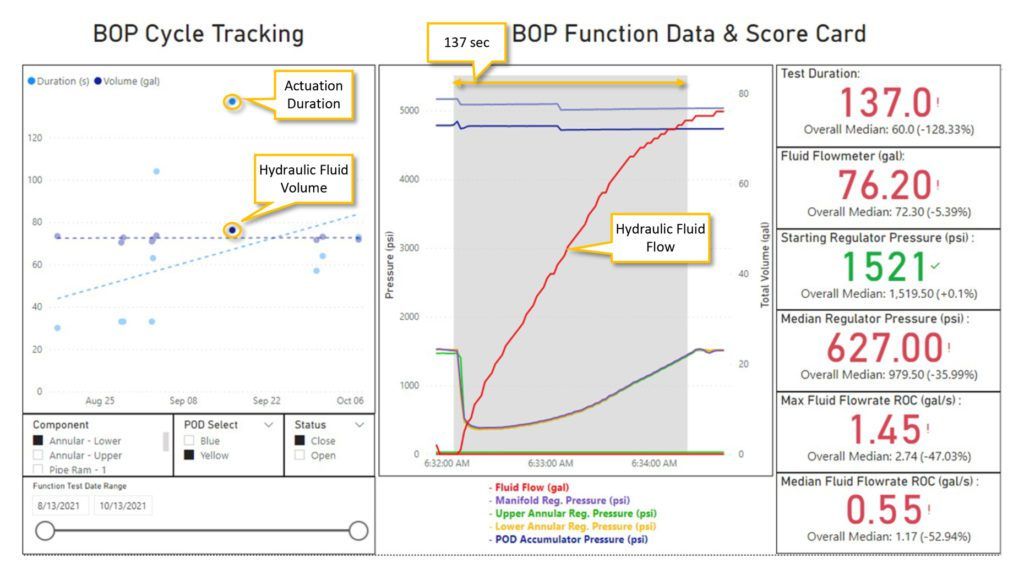
This last function test was also recorded by the rig crew using the traditional process of monitoring readback pressures and manual time keeping. The time to close was recorded as 58s, which accounted for less than half of the real overall closing time. Using algorithmic detection removes any inconsistencies in reporting from processes that were previously done manually. This also improves transparency into rig operations with onshore teams and ensures adherence to regulatory and policies for safer operations.
The previous example demonstrates how IPT’s automated function test algorithm, SureView web app and support team can help your BOP reliability team identify problematic components or procedures to improve safety, efficiency, and compliance with regulatory and operator requirements. Using our algorithms to identify the underlying factors of BOP component degradation, we will partner with you to build a Condition-Based Maintenance program that can:
IPT is directly involved in crafting industry best practices and procedures for CBM with the API SC16 technical committee in partnership with super-majors and global operators. For over a decade, IPT’s SureView platform has given customers the ability to store BOP test data, equipment reports, and failure reports that can now be used for CBM. Customers can also use SureView to store any information from sensors or other asset data sources connected to programmable logic controllers (PLCs). From this data, we use our proprietary algorithm to detect and extract function test data to gain insight into the current health trends of BOP components. Our automated algorithm and team will identify problematic components or processes to help keep your operations safe and accountable to regulatory or operator requirements.
IPT Global partnered with a major global operator to standardize and optimize fleet-wide BOP testing. This collaborative initiative resulted in over 33 days or 800 hours of deepwater rig time savings per annum for the customer. In addition to creating value through gained efficiencies, IPT Global continues to protect value for this client through enhanced assurance of well barrier integrity across their operations.
Prior to this fleet-wide initiative, the operator did not have a standard approach to BOP testing. Operations varied across regions using a combination of SureTec PressureTesting, circular chart recorders, and competitor digital chart solutions. This was an opportunity to ensure effective implementation of process safety policies and to drive efficiency across global operations.
IPT Global’s performance advisor partnered with the client’s teams to ensure accelerated learning by utilizing big data and analytics that made performance visible and transparent. Implementation of IPT Global’s PressureTesting solution fleetwide increased efficiencies in regions where inferior solutions were previously used. Adoption of one standardized digital solution allowed for consistent assurance practices to meet internal requirements, compliance with regulatory requirements, and remove sources of human error from operations.
During test design and planning, all test plans were created and optimized using PressureTesting’s TestPlanner module to ensure compliance and consistency with company policy and regulations. IPT Global’s SMEs generated and optimized test plans based on decades of experience across multiple global operators. A wholesale reduction of three to four test steps per test resulted in reduced component wear and tear, extending mean- time between failures while reducing maintenance and operational time and costs across the fleet.
In addition to test step reduction and optimization, deepwater projects that adopted the PressureTesting digital solution benefited from over 25% time savings per test with IPT Global’s advanced algorithms. Algorithms that are not only fast and efficient, but stringent and rigorous as well, providing industry-leading assurance that all leaks are detected early.
After global implementation of SureTec PressureTesting, all of the regional operations were fully documented in standardized reports and archived in IPT Global’s cloud-based collaboration hub. IPT Global’s performance advisor consulted with the client teams to define custom performance metrics and KPIs to track within PressureTesting. Once this information was transparent across the fleet, the team was able to identify opportunities for performance and process improvements and to share key learnings.
Through a collaborative and trusted partnership, the fleet-wide implementation of SureTec PressureTesting resulted in more than 800 hours, or 33 days, of critical path time savings per year for BOP testing. This was achieved through a global initiative to consult with IPT Global SMEs, who identified opportunities to reduce waste in test plans by eliminating steps; and by implementing the most efficient and robust digital solution for well barrier verification.
IPT Global’s performance advisor was able to provide a holistic perspective across the operations to share best practices, and identify accelerated learning opportunities that improved overall operational efficiency. Applying PressureTestingas a global digital solution was a critical step towards removing sources of human error from operations and to ensure that all regions were following standard practices and procedures.