
Most digital pressure testing applications on the market regularly pass leaks due to a lack of advanced data analysis. Operators and contractors should be concerned that digital solutions use standard decline analysis to validate high-pressure tests on critical rig equipment and do not account for thermal effects.
The lack of accurate leak detection on blowout preventers (BOPs), production trees, and well barrier elements increases the risk of process safety incidents, which puts operations at risk of harm to the environment, people, and assets because of increased risk of process safety incidents due to lack of leak-detection on BOPs, production trees and well barrier elements.
Many digital pressure testing alternatives falsely claim to be predictive by using a curve extrapolation for pressure decline analysis. There is no truly predictive product on the market that utilizes machine learning and artificial intelligence.
However, one digital pressure testing solution using advanced analysis algorithms has transformed one of the industry’s most consequential assurance activities.
This case study shows how IPT Global’s SureTec® PressureTesting solution, using algorithms, developed with the world’s largest pressure testing database, detected potential leaks that were missed by a competing digital pressure testing vendor for two high-pressure tests. Importantly these tests were during live operations offshore.
Decline analysis uses a percentage of the required test pressure as the criteria to determine the allowable pressure drop over a given period (typically 5 minutes). For example, if a system has a test pressure of 10,000 psi and the vendor selects 0.5% as the Decline criteria, then the acceptable pressure loss is calculated as follows:
Acceptable Pressure Loss = (Criteria x Test Pressure) = 0.005 x 10,000 psi = 50 psi
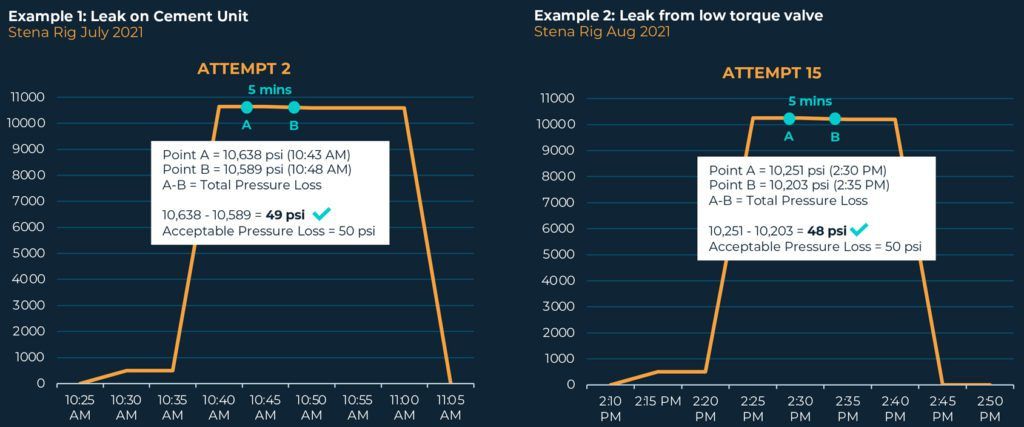
The same decline criteria and required test pressure were used in high-pressure tests on a cement unit and a low torque valve shown in Figures 1 and 2, respectively. During the tests, two data points (A and B) were selected five minutes apart by the competitor software. Using the above decline criteria, both tests passed because the respective pressure losses of 49 psi and 48 psi were less than 50 psi.
Using decline criteria alone to validate critical components ignores the thermal effects of pressurization on the system. Pressurization increases the temperature of the system, and the pressure decreases when the system cools during shut in.
It’s the same effect that occurs when car tires lose pressure in the winter. As a result, when the system is shut in to monitor the pressure, part of the pressure drop is due to cooling of the test fluid as the system loses heat to the surroundings. Because of its simplicity, standard digital testing utilizing decline analysis cannot distinguish between pressure loss due to thermal effects and pressure loss due to a potential leak.
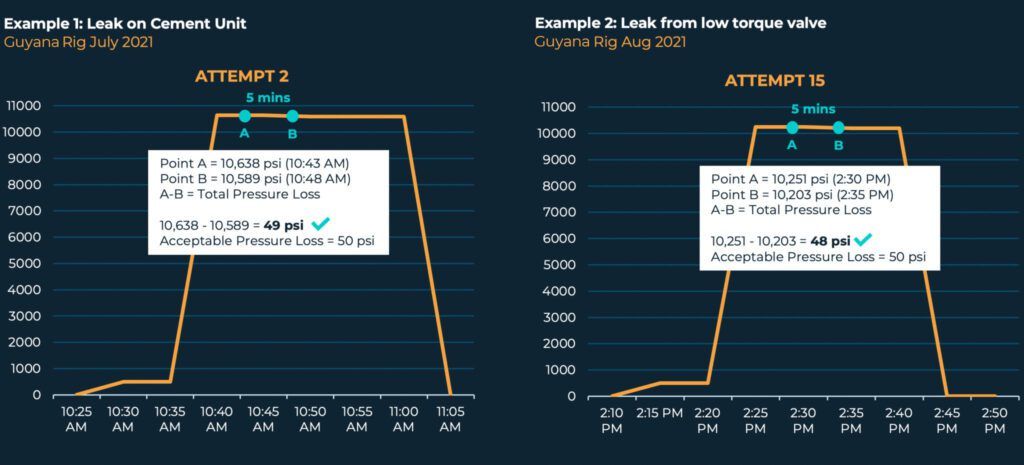
Example 1 – Example of competitor digital solution passing a test with pressure loss of 49 psi. This large pressure drop was allowed due to a lack of advanced algorithms, only available through IPT Global’s PressureTesting. PressureTesting removed the thermal influence and identified a leak on the cement unit.
Example 2 – Example of a competitor digital solution passing a test with a pressure loss of 48 psi. This large pressure drop was allowed due to a lack of advanced algorithms, only available through IPT Global’s SureTec PressureTesting solution. PressureTesting removed the thermal influence and identified a leak on the lower torque valve.
To demonstrate that competing digital approaches are inadequate for leak detection, the same tests were analyzed using Global’s PressureTesting solution with a field-tested physics-based advanced analysis. This analysis uses strict criteria to detect a leak with a high level of confidence.
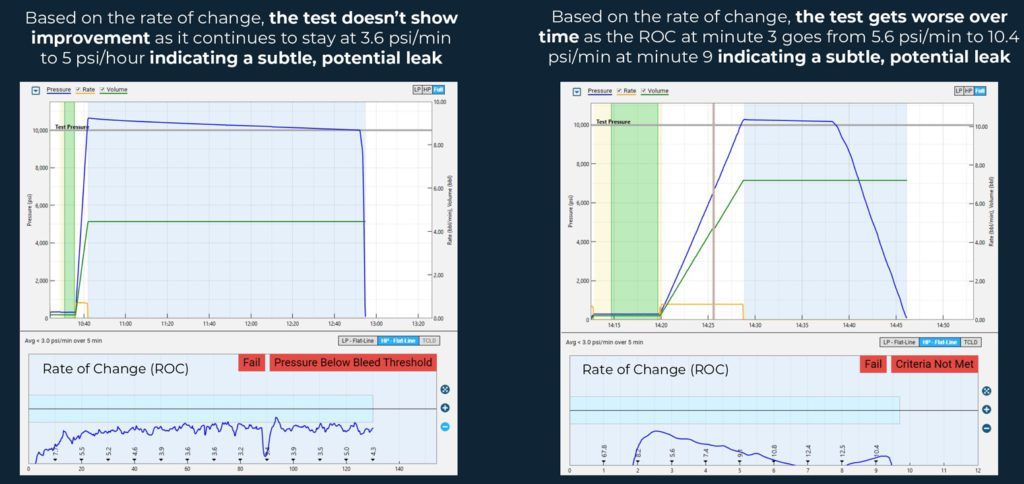
The IPT Global analysis failed the same tests that passed using a competing digital solution. IPT Global technology was able to differentiate thermal influences as the test fluid cooled off during testing.
Accurate leak detection depends on testing methods that go beyond simple curve extrapolation. IPT Global’s PressureTesting solution applies physics-based layered algorithm validation, to confirm the integrity of critical equipment and well barrier elements with objective, repeatable results.
Contact us to learn how PressureTesting’s leak detection capabilities can support your operations.
IPT Global’s SureTec PressureTesting solution is, the leading software for digital pressure testing and integrity assurance throughout the well’s lifecycle. From pre-deployment to P&A, PressureTesting enables procedural compliance with easy-to-use modules for designing, planning, testing, and reporting to drive higher levels of operational performance, assurance, and safety. PressureTesting is the only tool on the market where all relevant workflows are part of one seamless application to ensure the highest levels of performance, transparency, and compliance.
SureTec PressureTesting TestPlanner and WellSchematic modules provides interactive schematic builders to properly depict the design and layout of the blowout preventer (BOP), production trees, manifold, and wellbore. Once the schematics are built, test plans are made to comply with required acceptance criteria and process standards.
The SureTec PressureTesting solution can be utilized for all aspects of pressure testing, including integrity- critical equipment and well barrier elements. Examples of testing include: BOP testing, casing tests, well barrier elements, and completions, production, intervention, and plug and abandon tests.
Planning tests accurately without the proper tools can result in errors and omissions unless time-consuming checks and reviews are performed. Even after review, many plans often change somewhat at testing time, which makes assuring all components are tested properly very difficult. Through its TestEngine and TestPlanner modules, PressureTesting offers its provides an exclusive dynamic coverage capability and pressure path visualizations that ensure all required components are tested to the proper pressure and configuration. This coverage capability allows the user to easily assign which sides of valves and which components are to be tested to certain pressures and confirms that all will be tested properly prior to pressure testing. Dynamic coverage tracking allows test plans to be modified at test time and automatically communicates coverage status and alerts. This further ensures all required components and barriers are properly validated even when test plans must adapt to changing conditions.
For further assurance, PressureTesting’s DigitalApprovals module works in conjunction with TestEngine and TestPlanner, providing cloud-based collaboration, version control, review and approval, and fully auditable records of activity. This eliminates the need to email spreadsheets and other documentation back and forth, ensuring streamlined communications.
The SureTec PressureTesting solution validates the integrity of critical well control equipment and well barrier elements through multi-dimensional layered algorithms. These algorithms provide objective pass/fail test results
Decline Analysis is the industry standard test validation method that was originally derived from circular chart recorders (CCRs). Basic digital alternatives to the CCRs utilize decline analysis and often tout it as being predictive, based on simple curve extrapolation. IPT Global recognized this as a major assurance opportunity and sought to develop algorithms that provide higher assurance and efficiency to test validation.
IPT Global leads the industry in advanced analytics and has developed additional algorithms to validate tests, based on an extensive test database. IPT Global’s proprietary algorithms allow us to push past industry standards for more assurance. These additional analyses add extra layers of validation, which improves accuracy and efficiency. Moreover, our algorithms offers critical time savings with each test potentially passing in as fast as seven minutes. From 2015 to 2022, TCLD has saved our customers over 11,000 hours of rig time. For increased assurance, IPT Global’s Trend Analysis can be used with any testing criteria to confirm the pressure ROC is continuously improving. SureTec PressureTesting can also simultaneously test casing with the BOP for additional time savings.
IPT Global’s testing algorithms provide the highest levels of efficiency and assurance to ensure well integrity. Our Inflow Testing criteria offers unmatched assurance by removing subjectivity in test interpretation. IPT Global also has developed the ability to execute up to four tests simultaneously. This capability is critical for high volume testing operations, such as during completions.
The PressureTesting modules Compliance Reporting and Performance Reporting generates test reports with all relevant information to the operation. Another PressureTesting exclusive requires any failed test attempts be fully documented for full transparency and to avoid unnecessary regulatory non-conformance. All reports are stored in the Cloud for easy access to relevant personnel. With comprehensive yet clear test results, these reports are essential in improving communications during operations and handover, as well as useful for regulatory bodies and any internal or external audits.
SureTec PressureTesting brings digital pressure testing, Cloud access, and IPT Global’s together in one solution, including multi-testing and inflow testing capabilities. Contact us today to learn how IPT Global can help solve your pressure testing needs.
Managed Pressure Drilling is a process that uses a closed-loop circulation system for more accurate bottom hole pressure control, resulting in higher drilling efficiency and the prevention of drilling hazards. More operators are turning to IPT to validate the integrity of critical equipment and ensure that the benefits of Managed Pressure Drilling are realized.
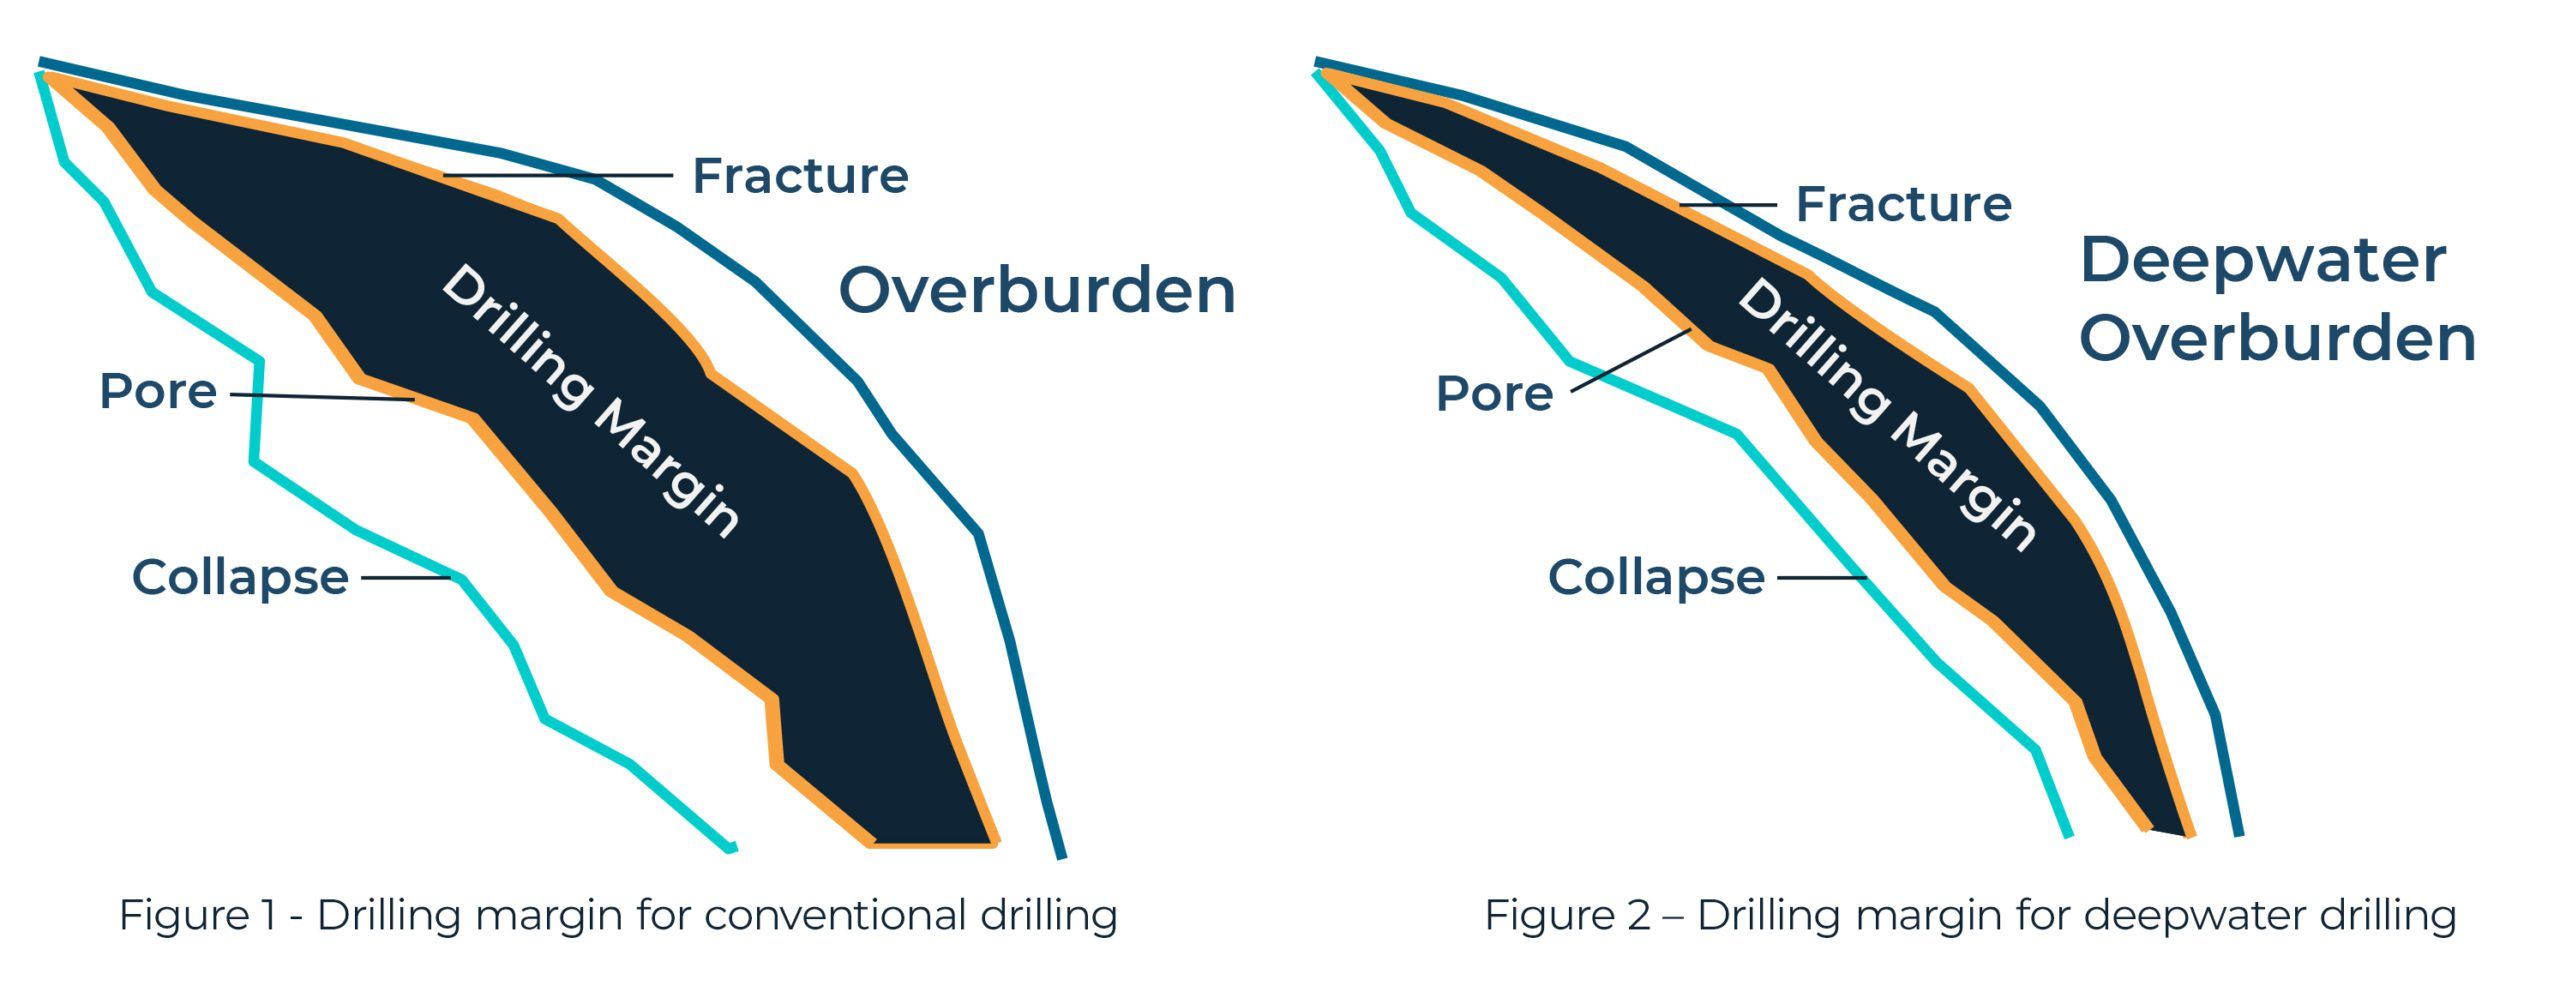
In conventional (onshore) drilling, the circulating system operates in a flow path that is open to the atmosphere. To control the well, drilling engineers adjust the mud density and may also use the equivalent circulating density (ECD) to maintain the bottom hole pressure (BHP) within a drilling margin determined by the formation’s pore pressure and fracture pressure (Figure 1). After the mud exits the top of the wellbore, it goes through a flowline to mud-gas separation and solids control equipment before being recirculated in the well. When the pumps are circulating mud in the hole, the BHP is a function of the hydrostatic pressure plus the annular friction pressure of the mud. When the pumps are turned off to make connections, the BHP is controlled solely by the hydrostatic pressure of the mud in the hole.
Drilling using an open circulating system presents challenges to control BHP in deep wells. First, small changes in mud density have a large impact on the hydrostatic pressure. Also, deep wells have high annular friction losses, resulting in large changes in BHP when the pumps are turned off. If the BHP becomes greater than the hydrostatic pressure of the mud, an influx of formation fluids can create a kick. The driller tries to control a kick by adjusting the mud density and shutting in the well to monitor the pressure. Then the driller circulates the kick out of the hole at a slow pump rate. The repeated cycles to kill the well and circulate out the kick significantly increases non-productive time (NPT) and safety risks.
Drilling margins are narrower in deepwater where the overburden pressure of seawater is less than that of rock and the formation strength is lower (Figure 2). As a result, it is standard practice in deepwater to set numerous casing strings at shallow depths to avoid extensive lost circulation.
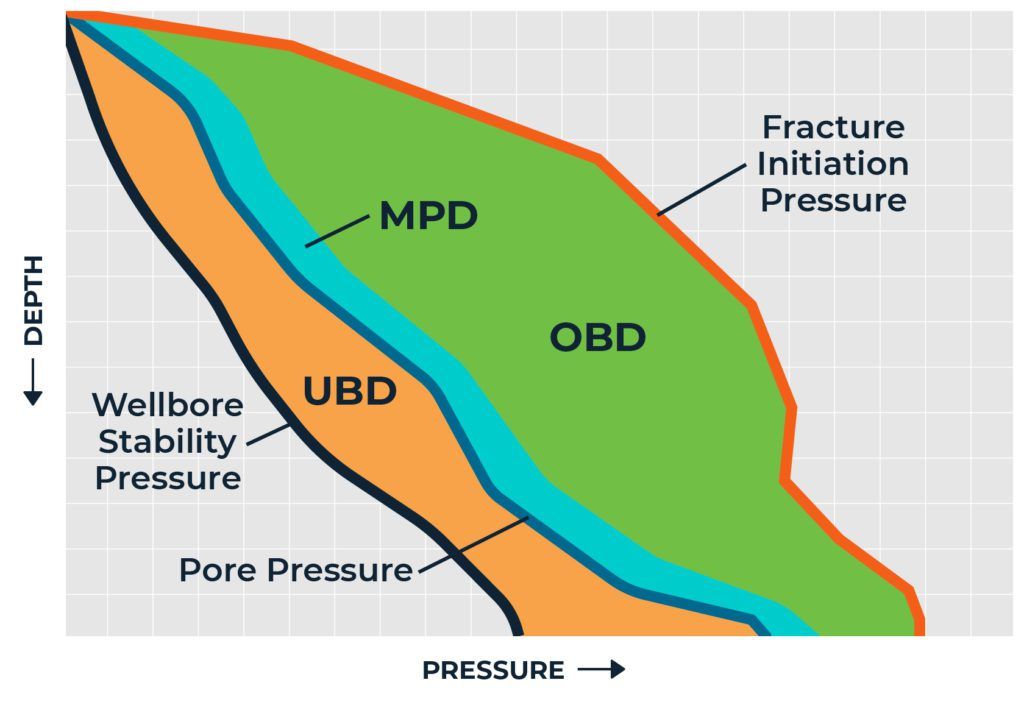
Managed Pressure Drilling (MPD) is a closed circulation system that allows drillers to monitor the wellbore’s annular hydraulic pressure profile more accurately and react in real time to precisely control BHP. The annular hydraulic pressure is maintained slightly above the pore pressure to prevent the influx of formation fluids and also well below the fracture pressure to avoid loss of circulation. Preventing these hazards improves safety and greatly reduces NPT in complex wells by increasing operational drilling efficiencies. MPD makes access to older depleted reservoirs possible and allows operators to drill previously “undrillable” wells. MPD can also reduce the number of casing strings required, thereby reducing trips and saving time, in addition to allowing a well to be completed in a larger hole size.
IPT provides the highest level of Managed Pressure Drilling component integrity assurance with our experienced Industry Experts and our applications, SureTec and SureView.
IPT works closely with operators, rig contractors, and Managed Pressure Drilling contractors to develop strategies that optimize test planning and execution. Typically, Managed Pressure Drilling component validation can be accomplished with relatively few additional tests during commissioning and BOP testing. IPT ensures that the required number, frequency, and types of tests are run to validate component integrity, avoid equipment-related NPT, and comply with local regulatory bodies.
SureTec allows existing BOP schematics to be used or modified for MPD test plans. SureTec’s Schematic Editor validates all connections and component names, making it easier to detect and correct errors compared to using complex rig piping and instrumentation diagrams (P&IDs). SureTec’s Plan Editor clearly identifies the test criteria, valve alignment, pressure path, and MPD components that will be validated in each test step.
SureTec uses proprietary algorithms and stringent criteria capable of validating MPD component integrity at low pressure to significantly reduce pressurized time and increase integrity assurance. SureTec’s advanced validation algorithms, such as Thermally Compensated Leak Detection (TCLD) are available in the Advanced and Premier tiers of SureTec.
SureTec generates standardized, detailed planning and test reports with complete documentation of test steps including pressure graphs, analysis charts, schematics, and tested components. IPT’s SureView Portal lets organizations archive and retrieve tests and analyze test results to share best practices and drive performance across teams.
Contact us today to find out how our team and applications can help you design, execute, and optimize your MPD program.
Well barriers consist of one or more well barrier elements (WBEs), and the failure of a single WBE can cause the well barrier to fail. If well integrity is compromised by the failure of a well barrier, it can result in loss of production and harm people, the environment, assets, and the operator’s reputation. The lack of validation criteria and the subjective interpretation of test results for critical WBEs are root causes of well integrity issues in the industry. IPT’s software, SureTec, uses proprietary algorithms and stringent criteria to significantly reduce pressurized time for testing WBEs and remove validation subjectivity, saving rig time and reducing risks.
If your organization uses circular chart recorders (CCRs) to verify the integrity of WBEs, a BSEE report cited the following problems associated with using CCRs.
There are several important advantages in going from using CCRs to SureTec for verifying well barrier integrity.
Digital validation with SureTec is more accurate than CCRs and uses transparent and objective criteria for validating pressure tests. SureTec uses proprietary algorithms to provide enhanced analysis for the most rigorous and effective testing in the industry. Our algorithms use transparent criteria that has been validated against a database of over 10,000 successful tests. The subjective interpretation of CCR tests is prone to human error.
SureTec provides a 30% reduction in test time versus CCRs by eliminating subjectivity and unnecessary pressurized time. Due to the accuracy of the testing with SureTec, the need to retest is eliminated. This improves safety by removing unnecessary pressurized time, which puts people, the environment, assets and reputation at risk.
SureTec provides comprehensive test reports to assure reliable handover with complete documentation. SureTec consists of tools that allow users to create custom schematics, visualize pressure paths and compare tests. Tests can be overlayed to show rate of change differences, pressure paths, and barriers throughout each step of a well’s lifecycle.
SureTec reduces costs by decreasing test time and increasing accuracy. This lowers risks, workforce hours, transportation, expenses from incidents, and reputation devaluation.
Our competitors primarily offer a testing method known as “Percent Decline” analysis, which is the minimum requirement by industry regulators. Percent Decline is a simple math calculation that divides the system pressure drop by a fixed time interval (e.g., 30 minutes). The validation criteria are based on a percentage of required test pressure. This means that the validation criteria fluctuate with the test pressure, making this analysis method incapable of consistently detecting a leak or differentiating between a leak and thermal influences on the test fluid.
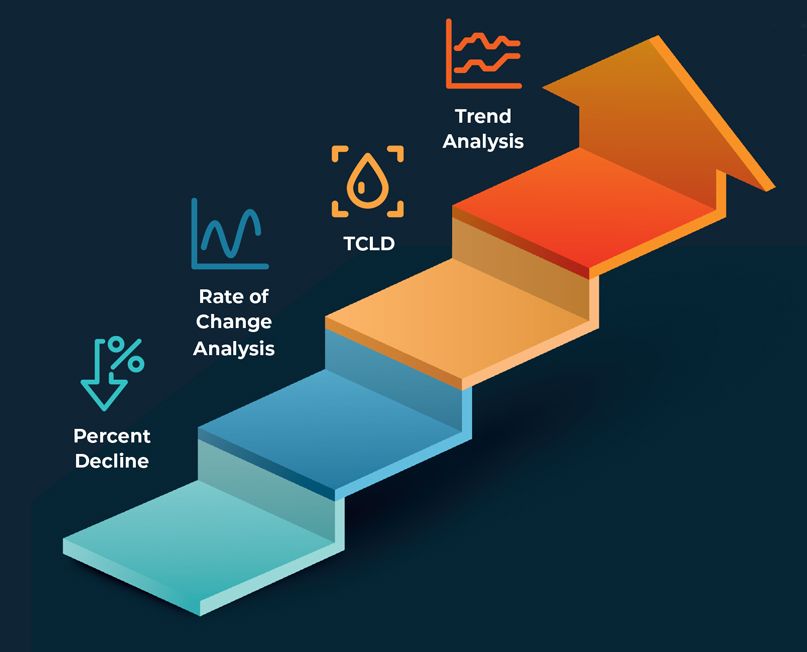
In general, digital testing solutions are more accurate, safe, and efficient than CCRs; however, the level of integrity assurance they provide depends on their analysis method and validation criteria. Percent Decline offers the lowest level of integrity assurance, so it should not be used alone to validate WBE integrity. SureTec surpasses Percent Decline with “multi-dimensional verification” of WBE integrity using advanced validation algorithms—Rate of Change analysis, Thermally Compensated Leak Detection, and Trend Analysis.
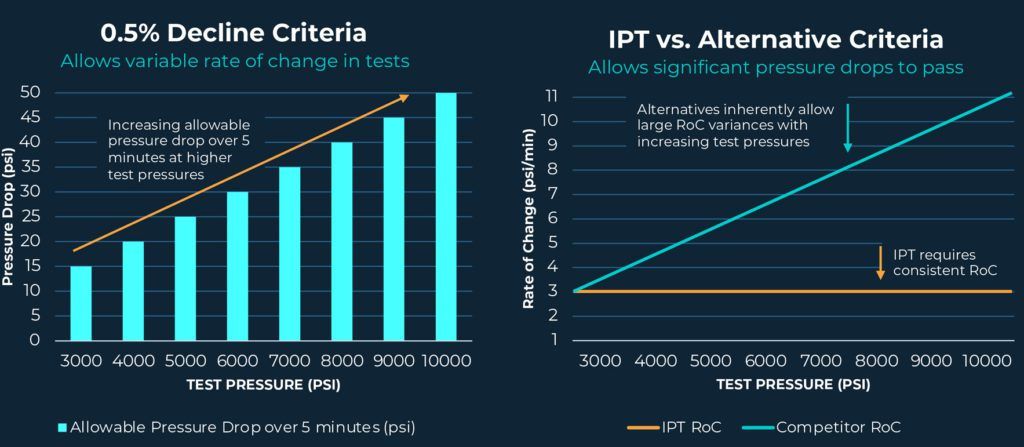
IPT’s pressure Rate of Change (ROC) analysis improves assurance by quantifying pressure stabilization over time. In other words, it determines the instantaneous rate of pressure change and will only pass a test if the pressure ROC is less than strict validation criteria, such as 3 psi/min over 5 minutes. In contrast, CCRs validate pressure tests at approximately 8-12 psi/min over 5 min.
Thermally Compensated Leak Detection (TCLD) uses ROC analysis to create a benchmark profile for each system tested. Then for subsequent test steps with a similar component grouping, test pressure, and type and volume of test fluid pumped, TCLD compares the pressure ROC to the benchmark profile. This allows TCLD to detect the smallest of deviations from the benchmark, similar to facial recognition, and thereby reduce test time with accurate leak detection and component verification.
Trend Analysis increases integrity assurance to the highest level by ensuring that the pressure ROC is improving over the validation interval. It can detect subtle leaks based on a non-improving or constant rate of change in pressure. This level of assurance is particularly applicable for stump testing where it is critically important to detect small leaks before splashing the BOP stack.
ROC, TCLD and Trend Analysis are available in the Advanced and Premier tiers of SureTec. For more information, request our white paper “Advanced Well Integrity Management with SureTec®”.
Condition-Based Maintenance (CBM) is preventive maintenance performed at a frequency based on the assessment of the actual physical condition of components or assemblies. CBM provides an alternative to schedule-based maintenance frequencies, which are commonly used for BOPs. CBM can reduce the risk of equipment failure by triggering maintenance earlier than would be performed by a standard schedule, if necessary. CBM can further reduce risk and lower overall maintenance costs by eliminating unnecessary preventive maintenance. The need for CBM is discovered using IPT’s proprietary algorithm that detects, extracts, and analyzes real-time operational and performance data from the rig. This data is displayed on IPT’s SureView dashboard. IPT’s team uses the data to implement a condition-based maintenance program.
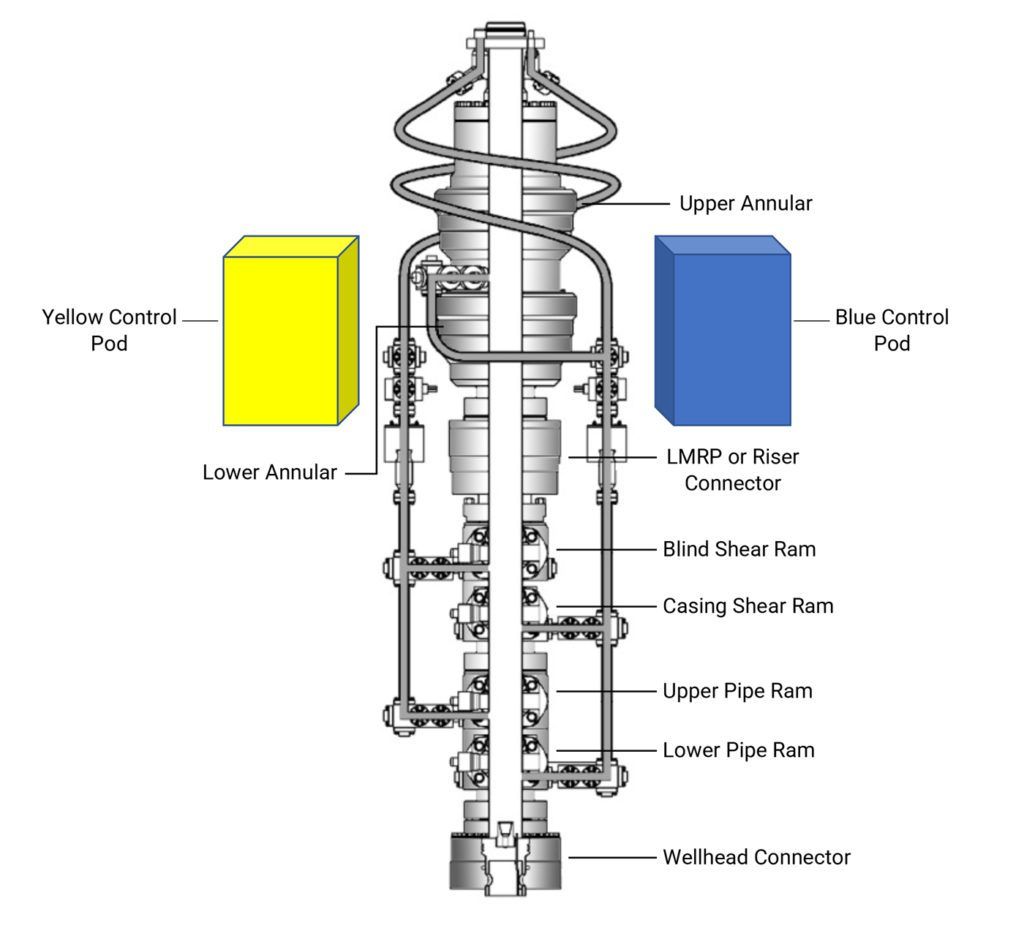
Subsea blowout preventers (BOPs) attach to the wellhead and serve as an important barrier element that prevents formation fluids and gases from flowing uncontrolled to the rig floor and causing a kick or blowout. BOPs consist of redundant control pods and electronically and hydraulically powered components such as hydraulic connectors, upper and lower annular preventers, casing and blind shear rams, and pipe rams. BOP accumulators provide sufficient pressure to operate these components when hydraulic and electric connectivity has been interrupted. BOP components must be periodically tested to ensure proper operation in an emergency.
Operators must periodically pressure test and function test BOP stack components, which decreases efficiency of drilling operations. BOP pressure tests are performed at regular intervals typically ranging from 14 to 30 days as set by local regulatory bodies. A single BOP pressure test consists of several steps that are performed at low or high pressure to detect a leak in the piping, manifold, or BOP components. Each step involves isolating a system, pressurizing it, shutting it in, and analyzing the pressure change. BOP stack components may be pressure tested a dozen times or more during drilling operations for a single well. The total time for each complete BOP pressure test may take from 12 to 24 hours and increase the length of operations significantly.
BOPs components must also be function tested weekly by actuating (opening and closing) the annular preventers and rams to ensure they will operate properly in an emergency. Function tests are designed to monitor the time (seconds) and volume of fluid (gallons) it takes to actuate individual components, which are important parameters for CBM. The test procedure may vary by rig, but typically, a member of the subsea crew opens or closes individual BOP components from the control panel and manually records the actuation duration and fluid volume from analog or digital gauges.
The actuation duration and the volume of fluid are important indicators of the health of critical BOP components. If test measurements are analyzed over time along with equipment maintenance and failure tracking, the data can be used to spots trends that identify needed maintenance or indicate the imminent failure of a critical component.
The challenge is to analyze BOP test, maintenance, and failure data analyses so that operators can gain insight into when and why failures are happening. This will allow contractors to perform maintenance on BOP components when necessary, rather than on an arbitrary schedule as is commonly used.
IPT developed an automated physics-based algorithm that detects and extracts function test data from the real-time data on the rig in real time. IPT’s team of well control and BOP SMEs assisted with the algorithms development to ensure that the function test data are detected correctly, objectively, and consistently. The algorithms can detect parameters such as an increase in test duration, unusual hydraulic fluid flow volumes, or specific regulator pressure signatures. This information is extracted for all function tests performed and displayed on IPT’s analytics web app, SureView.
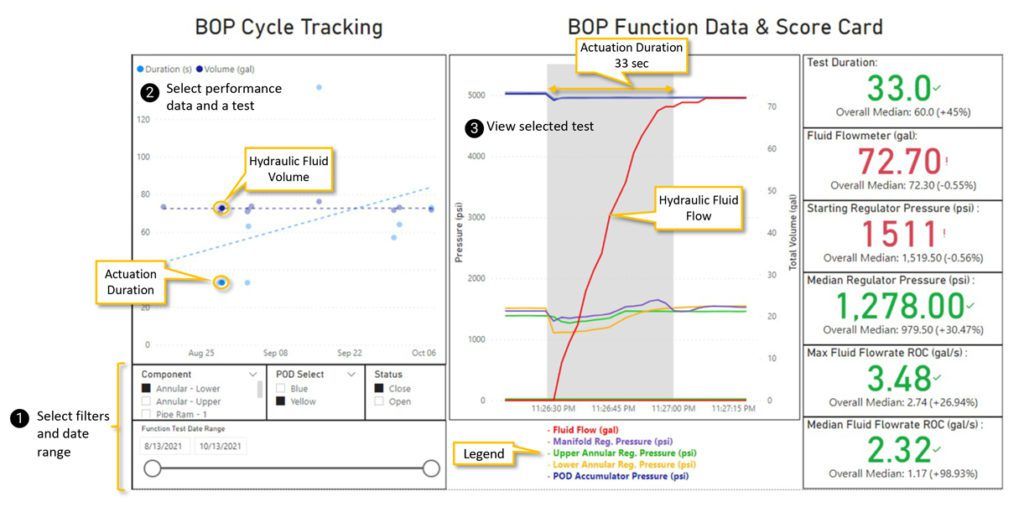
The figure below is a screenshot of IPT’s SureView dashboard for reviewing performance and function test data extracted by the algorithm. The steps to use the SureView dashboard are as follows:
The Function Test Data chart below shows that after the signal to close was initiated, the fluid flow steeply increased, and the valve started to actuate. The upper and lower annular regulator pressure dropped quickly and then returned gradually to their starting pressure. The Score Card shows that the function test compared well to other tests results because four values (in green) were better than their respective median values and two values (in red) were slightly above their median values.
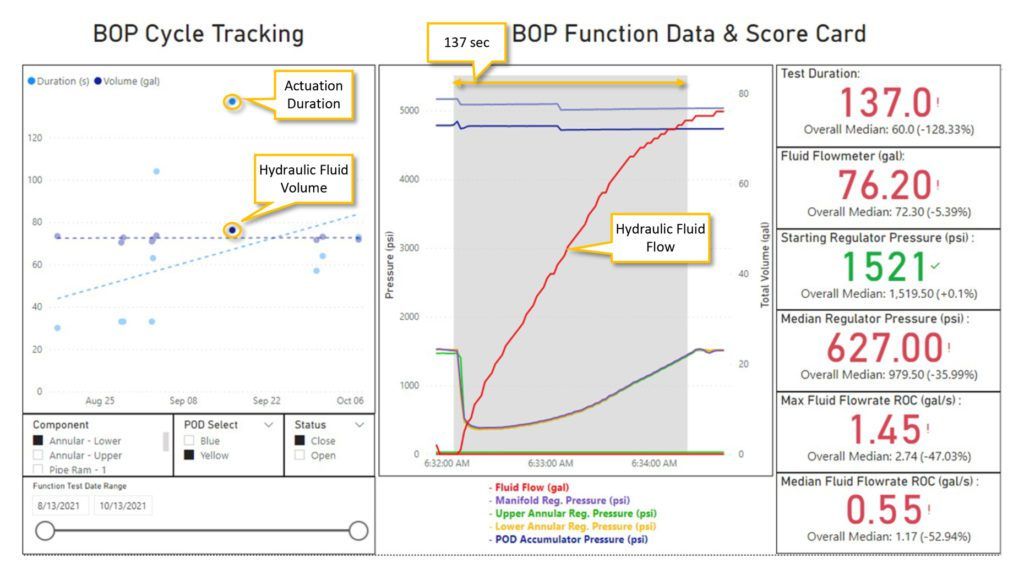
The next screenshot is an example of a function test that did not perform as well compared to other tests. Using the same filters as the previous example, the user selected the largest outlier in the BOP Cycle Tracking chart. The Score Card quickly shows that five parameters were worse than their median values. The Test Duration is more than twice the median value. The Median Regulator Pressure and Max Fluid Flowrate ROC are significantly less than their median values.
The BOP Function Data chart shows the details behind the values in the Score Card. The Regulator Pressure quickly declined and stayed low until it finally recovered to its initial levels over two minutes later. The Fluid Flow shows a slower rate compared to previous tests, less than half of our previous test. Both of these factors contributed to the longer test duration and can be used in failure analysis and investigation.
This last function test was also recorded by the rig crew using the traditional process of monitoring readback pressures and manual time keeping. The time to close was recorded as 58s, which accounted for less than half of the real overall closing time. Using algorithmic detection removes any inconsistencies in reporting from processes that were previously done manually. This also improves transparency into rig operations with onshore teams and ensures adherence to regulatory and policies for safer operations.
The previous example demonstrates how IPT’s automated function test algorithm, SureView web app and support team can help your BOP reliability team identify problematic components or procedures to improve safety, efficiency, and compliance with regulatory and operator requirements. Using our algorithms to identify the underlying factors of BOP component degradation, we will partner with you to build a Condition-Based Maintenance program that can:
IPT is directly involved in crafting industry best practices and procedures for CBM with the API SC16 technical committee in partnership with super-majors and global operators. For over a decade, IPT’s SureView platform has given customers the ability to store BOP test data, equipment reports, and failure reports that can now be used for CBM. Customers can also use SureView to store any information from sensors or other asset data sources connected to programmable logic controllers (PLCs). From this data, we use our proprietary algorithm to detect and extract function test data to gain insight into the current health trends of BOP components. Our automated algorithm and team will identify problematic components or processes to help keep your operations safe and accountable to regulatory or operator requirements.
IPT Global partners with the OSDU Forum. The OSDU Forum is an oil and gas group who delivers open source, standards-based, technology agnostic data platforms for the energy industry.
IPT is a leader in the Well Planning Reference Data Group of the OSDUTM Forum. We have designed and proposed data schemas for Well Barrier Elements and Pressure Tests which have been accepted by the OSDUTM Forum and its 226 member organizations. This ensures reliable and efficient data integrations resulting in industrialized data management for operators and contractors who adhere to the standards.
This standards-based approach to data platforms helps reduce data silos, enable transformational workflows and accelerate the deployment of emerging digital solutions for operators and drilling contractors.
Our clients gain an advantage utilizing our data integrations as part of IPT’s SureView® Application Programming Interfaces (APIs). We partner with our clients to provide these APIs using industry standard service bus technology. During planning, testing, and real-time operations, IPT transfers data to the assurance record management systems and data lakes used by our customers utilizing SureView® APIs.
If you are interested in learning more about these capabilities and how IPT Global can help you access, store, and analyze data from your operations, please contact us.
IPT will continue to be an active participant in the OSDU Forum to define and follow industry standards beneficial to our customers.
IPT Global partnered with a major global operator to standardize and optimize fleet-wide BOP testing. This collaborative initiative resulted in over 33 days or 800 hours of deepwater rig time savings per annum for the customer. In addition to creating value through gained efficiencies, IPT Global continues to protect value for this client through enhanced assurance of well barrier integrity across their operations.
Prior to this fleet-wide initiative, the operator did not have a standard approach to BOP testing. Operations varied across regions using a combination of SureTec PressureTesting, circular chart recorders, and competitor digital chart solutions. This was an opportunity to ensure effective implementation of process safety policies and to drive efficiency across global operations.
IPT Global’s performance advisor partnered with the client’s teams to ensure accelerated learning by utilizing big data and analytics that made performance visible and transparent. Implementation of IPT Global’s PressureTesting solution fleetwide increased efficiencies in regions where inferior solutions were previously used. Adoption of one standardized digital solution allowed for consistent assurance practices to meet internal requirements, compliance with regulatory requirements, and remove sources of human error from operations.
During test design and planning, all test plans were created and optimized using PressureTesting’s TestPlanner module to ensure compliance and consistency with company policy and regulations. IPT Global’s SMEs generated and optimized test plans based on decades of experience across multiple global operators. A wholesale reduction of three to four test steps per test resulted in reduced component wear and tear, extending mean- time between failures while reducing maintenance and operational time and costs across the fleet.
In addition to test step reduction and optimization, deepwater projects that adopted the PressureTesting digital solution benefited from over 25% time savings per test with IPT Global’s advanced algorithms. Algorithms that are not only fast and efficient, but stringent and rigorous as well, providing industry-leading assurance that all leaks are detected early.
After global implementation of SureTec PressureTesting, all of the regional operations were fully documented in standardized reports and archived in IPT Global’s cloud-based collaboration hub. IPT Global’s performance advisor consulted with the client teams to define custom performance metrics and KPIs to track within PressureTesting. Once this information was transparent across the fleet, the team was able to identify opportunities for performance and process improvements and to share key learnings.
Through a collaborative and trusted partnership, the fleet-wide implementation of SureTec PressureTesting resulted in more than 800 hours, or 33 days, of critical path time savings per year for BOP testing. This was achieved through a global initiative to consult with IPT Global SMEs, who identified opportunities to reduce waste in test plans by eliminating steps; and by implementing the most efficient and robust digital solution for well barrier verification.
IPT Global’s performance advisor was able to provide a holistic perspective across the operations to share best practices, and identify accelerated learning opportunities that improved overall operational efficiency. Applying PressureTestingas a global digital solution was a critical step towards removing sources of human error from operations and to ensure that all regions were following standard practices and procedures.
The petroleum industry continues to rely on antiquated analog methodologies and individual experiences to interpret pressure tests. These tests are fundamentally critical to verifying well barrier integrity which ensures protection of personnel, the environment and equipment.
Over a decade ago, IPT led a digital revolution and developed industry-leading technology to modernize well barrier assurance. Recently, IPT worked with a major oil and gas company to compare analog methods (circular chart recorder, CCR) with IPT’s digital well integrity management solutions.
The client’s shallow water and deep water Gulf of Mexico operations were early adopters of IPT well integrity solutions over a decade ago, but the client still had several regional operations that used circular chart recorders, including drillships in West Africa and in several onshore basins. The comparison trials ran on both land and deep water operations between IPT solutions and circular chart recorders to quantify the value in adopting a global well integrity management solution.
This trial demonstrated that the implementation of SureTec and SureView created immediate value with enhanced efficiencies and time savings on the rigs. Digital cloud-based data and archival ensure long-term record preservation, guarantee compliance and enhance safety across well barrier assurance processes in ways not possible with analog methodologies. In addition to the immediate value created with IPT solutions, the client’s value was was protected by assuring well barrier processes and program steps.
SureTec and SureView generated immediate value on the client’s projects compared to analog methods. IPT measured more efficient test validation times onshore and offshore. The client also benefited from qualitative efficiencies in processes, communication and generating information that could then be applied for continuous performance improvement.
In addition to immediately reducing costs through more efficient and effective operations, IPT solutions revolutionized the client’s assurance, confirming well barriers will perform as planned so that the operator’s reputation and license to operate was protected. The regional projects that were still using analog methods to verify barrier integrity posed invisible risks that would remain unknown until after a catastrophe occurred. Implementing the SureTec and SureView digital well integrity management system created opportunities to close process safety gaps across all of the client’s operations.
Prior to the comparison trials, some of the client’s staff believed a “free” solution would be sufficient to carry their operations. The side-by-side comparison left no question that SureTec and SureView, IPT’s digital well integrity management solutions, generated and preserved value.
In addition to validating tests 30% and 25% more efficiently, for onshore and offshore respectively, major efficiencies were gained from improved performance enabled through visible data, enhanced change management, collaboration and auditable record keeping. The operator has implemented IPT’s well integrity management solutions into all global operations as part of their assurance and integrity program, providing peace of mind that all of their operations would comply with internal and regulatory standards to ensure well barrier integrity. This enterprise level assurance minimizes client exposure to well integrity incidents that could impact people, equipment and the environment.
During the implementation of SureTec, a client remarked, “I’m so happy we are making the switch. Using this digital tool and being involved in the digital transformation is critical for assurance and driving efficiency.”
Let IPT be a part of your digital transformation and benefit from the application of digital data to drive cost savings and improve assurance to protect your company’s reputation and license to operate.