
Well integrity is fundamental to safe and efficient oil and gas operations. It refers to the ability of well barrier elements (WBEs) to prevent uncontrolled fluid flow from the reservoir to the environment. Maintaining the reliability of these barriers is essential for minimizing risk, avoiding costly incidents, and ensuring long-term sustainability.
Across the well lifecycle, from drilling and completion through production and intervention to plug and abandonment (P&A), each phase presents challenges that can compromise integrity. As wells age, equipment and materials degrade, operating conditions shift, and the potential for failure increases.
Ensuring integrity over decades requires centralized data management and full lifecycle visibility. Today, more than ever, Artificial Intelligence (AI)-driven analytics help detect, predict, and prevent issues before they escalate.
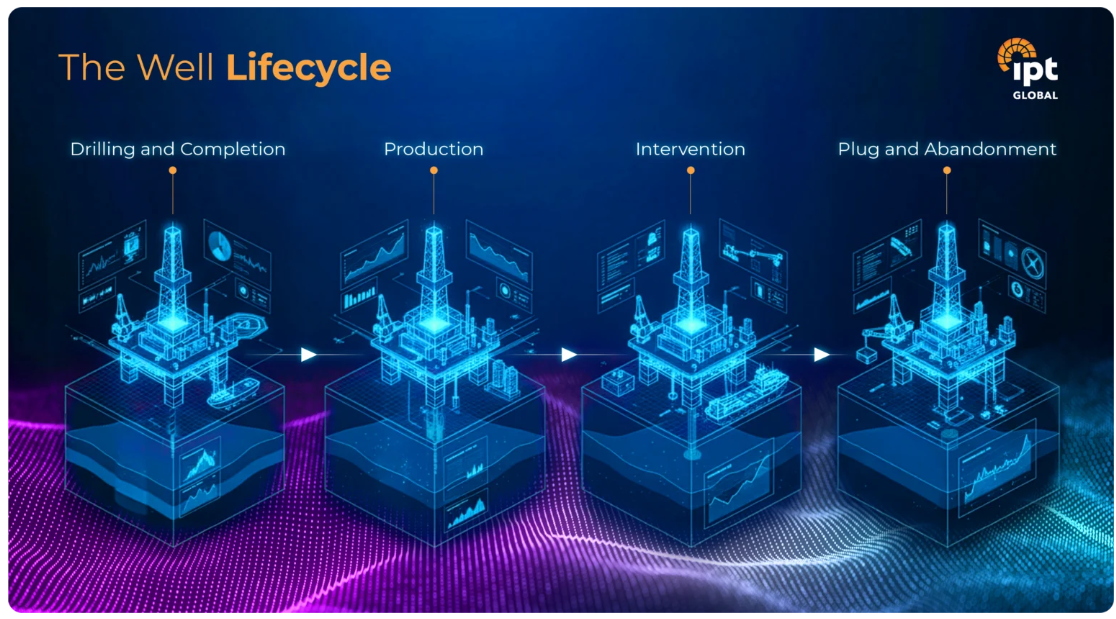
Historically, well integrity management has been fragmented across disciplines and vendors. Data from testing, inspection, and maintenance often resides in separate systems, limiting visibility and slowing response times. Inconsistent documentation and handovers between drilling, production, and abandonment teams create knowledge gaps that can lead to operational and safety risks.
Today’s operators face increasing regulatory scrutiny, growing environmental expectations, and ongoing cost pressures. Managing well integrity across the lifecycle is no longer just about compliance; it is about achieving continuous assurance and operational efficiency through intelligent, connected systems.
AI is transforming how the oil and gas industry approaches well integrity. As a result, modern well integrity software such as IPT Global’s SureTec® uses AI-driven analytics to convert large volumes of operational data, including pressure testing, sensor readings, maintenance logs, and inspection reports, into actionable results.
With AI-enhanced reporting and visualization, IPT Global engineers can identify trends across hundreds of wells, verify barrier status in real time, and prioritize interventions that reduce risk and downtime.
The foundation of well integrity begins with precise barrier verification and documentation. During construction, digital wellbore diagrams, automated test planning, and AI-assisted validation ensure that well barrier elements (WBEs) meet design standards. In addition, AI tools evaluate pressure test data using trend analysis and rate-of-change modeling to objectively confirm test outcomes. IPT Global’s SureTec platform provides integrated tools to accomplish this, through the WellSchematic and BarrierManagement and PressureTesting solutions.
This phase benefits from centralized cloud storage and approval workflows, ensuring regulatory traceability and efficient collaboration between the operator, service companies, and regulators.
Meanwhile, during production, operators must balance maximizing output with sustaining barrier integrity. AI-driven well lifecycle management systems consolidate real-time data from sensors, inspections, and historical reports to continuously assess the status of well barriers and envelopes.
By combining analytics and predictive modeling, production teams can detect corrosion, erosion, or equipment wear before they compromise safety. This intelligence supports decisions on workovers, interventions, or decommissioning, reducing unplanned shutdowns and ensuring regulatory compliance across operations.
IPT Global’s SureTec platform provides integrated tools to accomplish this, through the WellSchematic and BarrierManagement and PressureTesting solutions.
Workovers and interventions introduce added complexity with multiple crews, shorter timelines, and simultaneous testing. AI-enabled multi-test monitoring allows teams to track test results in real time and automatically flag deviations.
This approach improves the efficiency of barrier verification while maintaining full traceability. With consistent data flow from intervention to production, teams gain visibility into all well integrity tests, ensuring operational continuity and regulatory compliance.
IPT Global’s platform provides integrated tools to accomplish this, through the WellSchematic, PressureTesting, and Equipment Health Monitoring solutions.
In the final stage of the well lifecycle, the goal shifts from production optimization to environmental safety and regulatory compliance. Regulations vary globally, but all require thorough documentation of barrier verification and abandonment procedures.
AI-powered well integrity software aggregates historical WBE data, providing a complete picture of each barrier’s condition before, during, and after abandonment. Predictive analytics can detect defective cement, corrosion pathways, and equipment weaknesses before P&A operations begin. IPT Global’s platform provides integrated tools to accomplish this, through the WellSchematic and BarrierManagement, PressureTesting, and Equipment Health Monitoring solutions.
This data-driven approach supports a safe, verifiable, and auditable abandonment process, reducing risk and ensuring long-term environmental protection.
Across every phase, data is the foundation of well integrity management. Modern platforms integrate real-time testing data, historical maintenance records, and regulatory reports into a single unified view.
IPT Global’s advanced reporting and analytics capabilities, powered by AI, allow teams to:
By connecting data from drilling and production through abandonment, operators gain insight into well health across the full lifecycle, empowering proactive decision-making and improving safety performance.
Managing well integrity across the full lifecycle of a well is complex, but AI and data-driven insights are making it more predictable, transparent, and efficient than ever before.
By integrating AI-driven analytics, centralized data management, and intelligent reporting, operators can sustain well integrity, reduce non-productive time (NPT), and ensure environmental and regulatory compliance from drilling to abandonment. The future of well integrity lies in connected intelligence, where data, technology, and expertise converge to protect assets, people, and the planet.
As operators continue to evolve their approach to well integrity management, integrating new technologies like AI-driven analytics is key to sustaining well integrity over time. Yet, the fundamentals of sound barrier design, verification, and maintenance remain just as critical.
For a further look at how these well integrity principles apply across drilling, production, intervention, and abandonment, read our article Managing Well Integrity Over the Entire Well Lifecycle.
Blowout preventer (BOP) testing is a critical-path operation in drilling programs, but for this major onshore operator, it had become a persistent bottleneck. Average test durations exceeded six hours per BOP test, increasing non-productive time (NPT) and creating schedule challenges.
Beyond timing, the operator’s legacy methods, including circular chart recorders and outdated digital systems, made improving BOP testing efficiency increasingly difficult. These outdated tools often failed to capture complete assurance data, leaving quality issues undetected and complicating BOP testing compliance with API Standard 53.
The operator needed a digital solution to reduce BOP test time, improve BOP testing accuracy, and provide complete traceability across its rig fleet while supporting safer and more reliable well operations.
To address these challenges, the operator implemented IPT Global’s SureTec platform and its PressureTesting digital solution, designed to improve BOP testing workflows across its onshore rig fleet. Third-party testing companies used SureTec laptops at the rig site, while IPT Global’s Real-Time Operations Center (RTOC) in Houston provided remote technical support as needed. The solution’s high-resolution, real-time pressure data replaced manual readings and outdated tools to eliminate uncertainty and mitigate human error.
Automated validation and digital reporting streamlined the entire process, producing faster, more accurate, and fully verifiable results.
By digitizing and automating pressure test workflows with PressureTesting, the operator achieved a measurable step-change in operational efficiency. The solution replaced manual data capture and outdated systems with precise, real-time pressure data and automated validation tools. This transformation directly translated into faster test cycles, reduced rig downtime, and measurable gains in BOP testing efficiency.
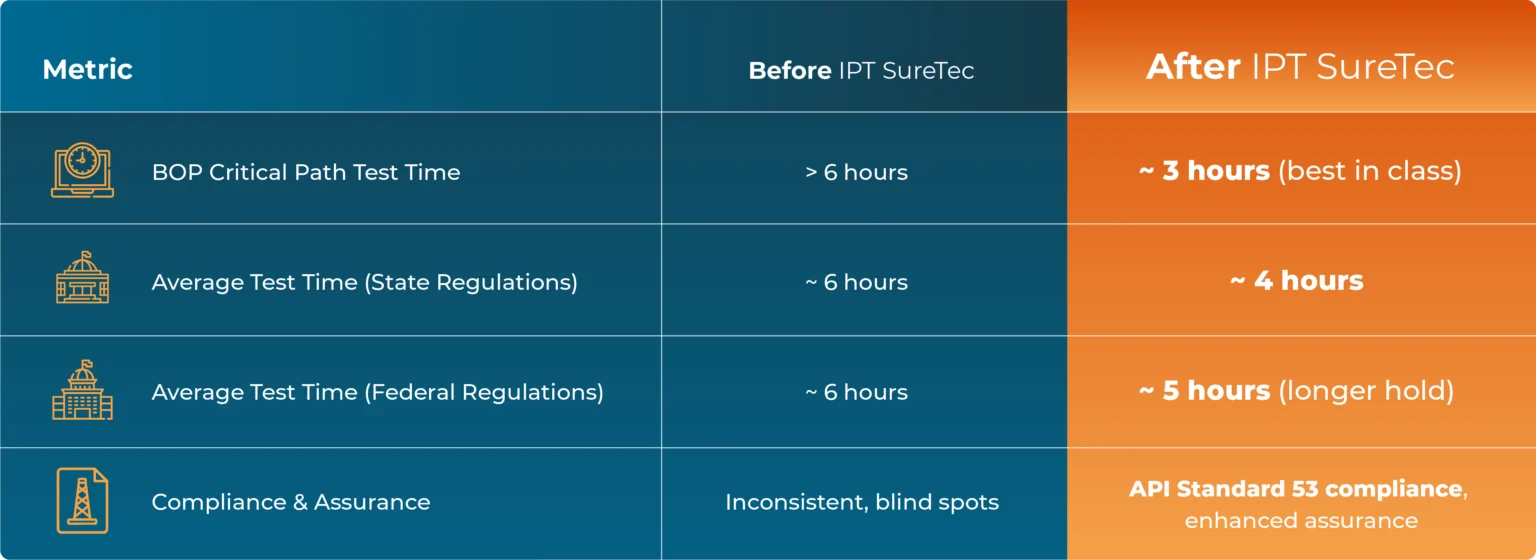
This performance represents a best-in-class reduction in test duration, significantly cutting overall BOP testing duration and improving rig uptime.
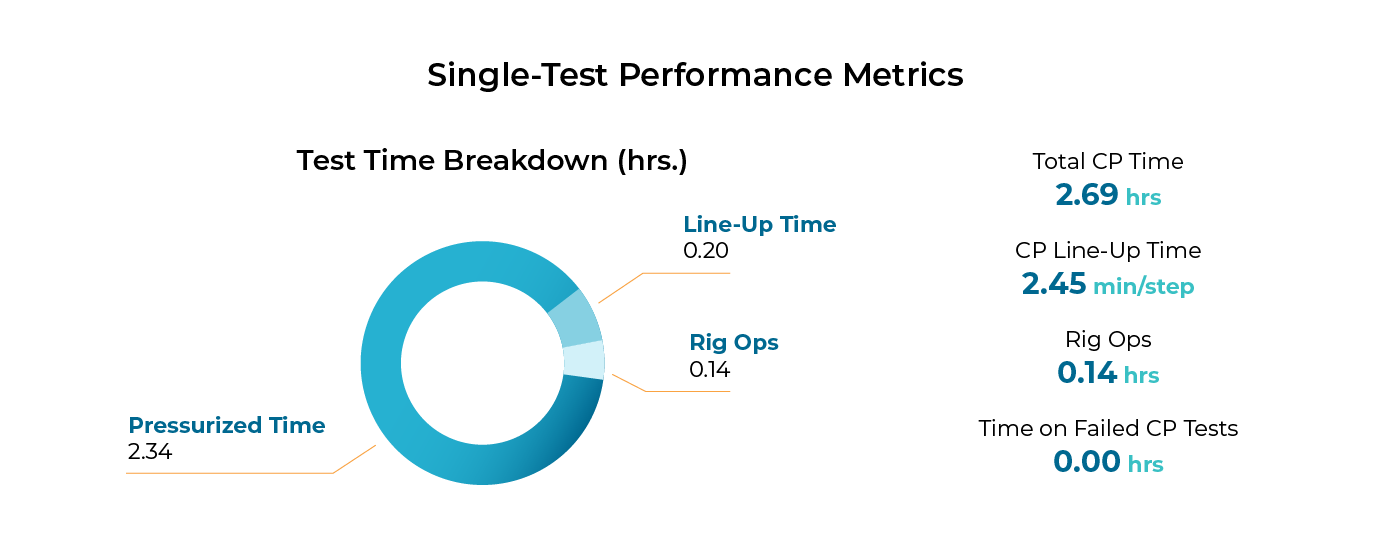
The charts below indicate a decreasing trend over a 4-year period for Total Test Time, Line-Up Time, and Rig Ops Time as a result of optimized BOP testing and learnings from the implementation of PressureTesting. The continued improvement is indicative of the ongoing value and effectiveness of IPT Global’s digital solutions.
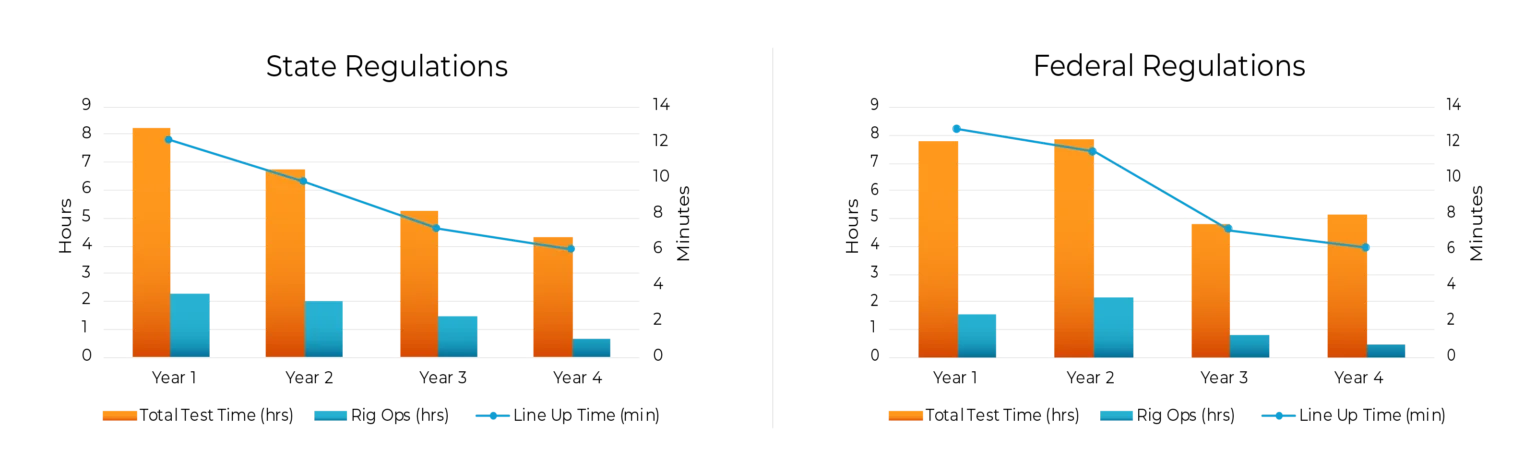
Consistent, verifiable test data and analysis is critical for maintaining compliance and preventing quality issues. With PressureTesting, the operator gained full traceability into every test event, allowing early identification of irregularities and ensuring that every BOP test aligned with API Standard 53 requirements.
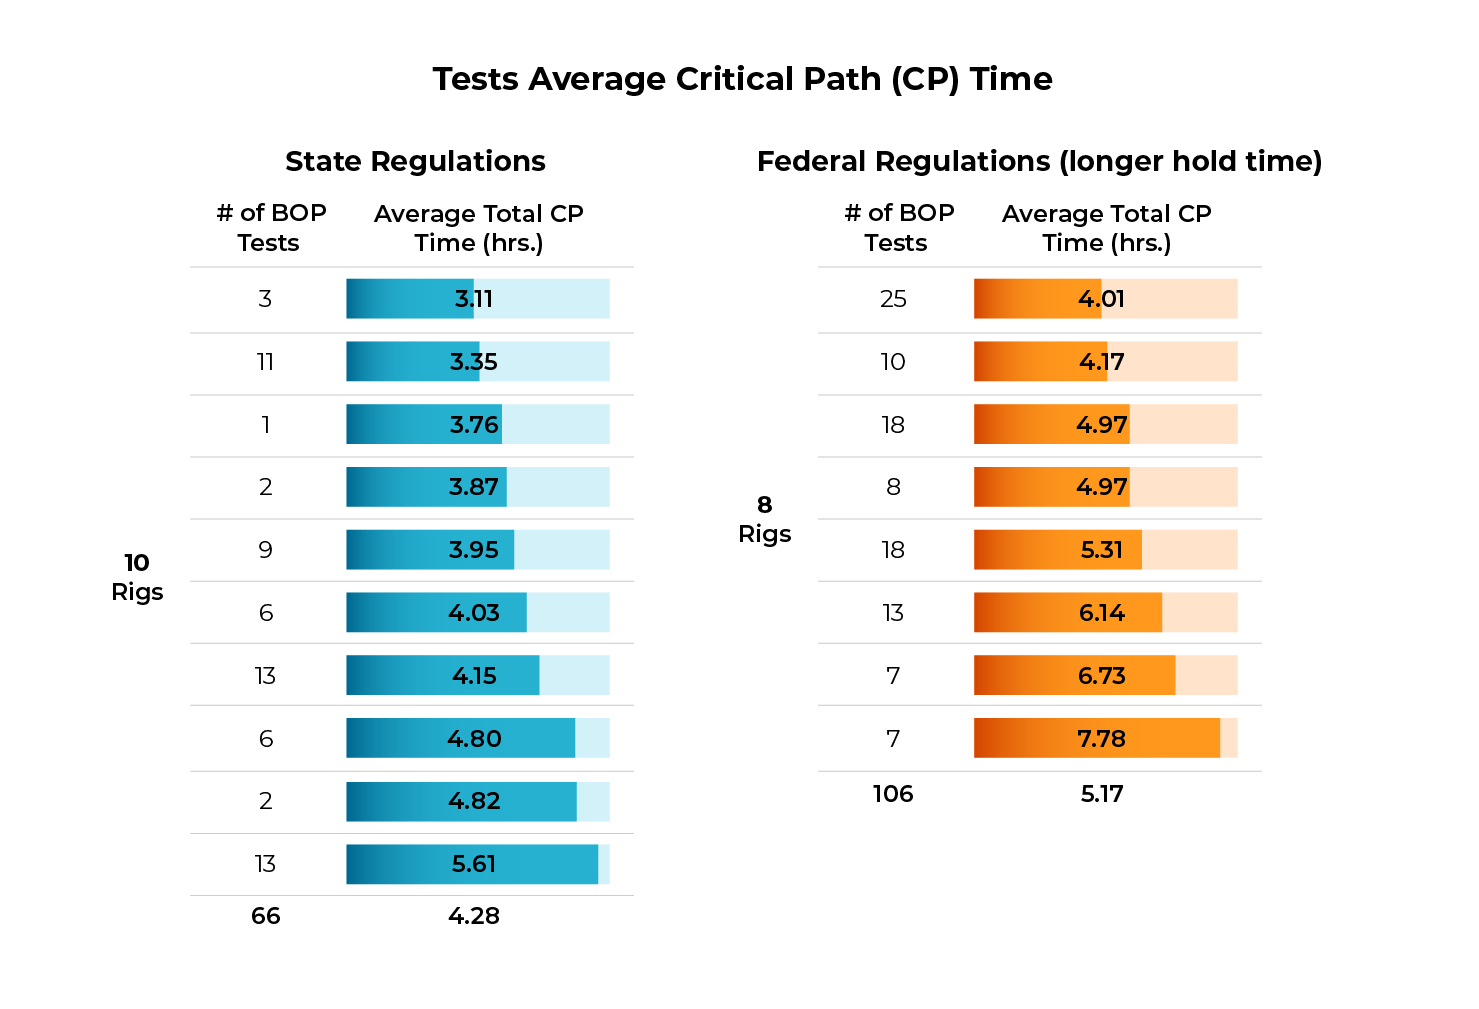
The chart below compares average BOP critical path test times for rigs under state and federal regulations. Despite longer federal hold requirements, SureTec’s PressureTesting maintained shorter average times and tighter variability, demonstrating consistent performance under all compliance conditions.
SureTec’s centralized digital test records allowed the operator to monitor trends, analyze test performance, and make real-time data-driven decisions faster than ever before. Over time, this capability improved its well integrity management program and established a culture of continuous improvement across rigs and over multiple years of operation.
What began as an effort to reduce BOP test time resulted in a transformation of the operator’s BOP testing workflow. With SureTec PressureTesting, the operator not only achieved faster testing but also improved quality control, regulatory compliance, and data visibility, which improved well integrity management across its entire rig fleet.
Today, IPT Global’s SureTec PressureTesting solution is setting the benchmark for improving BOP testing efficiency and helping operators reduce BOP test time across both onshore and offshore environments. The digital solution continues to set the standard for BOP testing accuracy and assurance, enabling operators worldwide to improve efficiency in BOP testing operations.
The oil and gas industry generates vast amounts of data at every stage of the well lifecycle: exploration, drilling, completion, production, and decommissioning. Yet much of it remains siloed and underutilized. The Open Subsurface Data Universe (OSDU™) addresses this challenge by providing a common framework for storing, accessing, and exchanging information across workflows.
At IPT Global, we believe the future of well assurance depends on combining advanced digital solutions with industry-wide standards. By aligning well integrity and operational data with these standards, operators gain new ways to improve efficiency, ensure compliance, and strengthen safety.
The OSDU Forum, launched by The Open Group, provides a neutral space where operators, service companies, and technology providers can standardize the way subsurface and operational data is structured, accessed, and shared. The Forum’s goal is to establish a common data platform that removes silos and promotes interoperability across digital tools.
Through this collaboration, the Forum unites operators, service companies, and software providers to create shared standards and reference implementations, forming the foundation for managing and exchanging energy data.
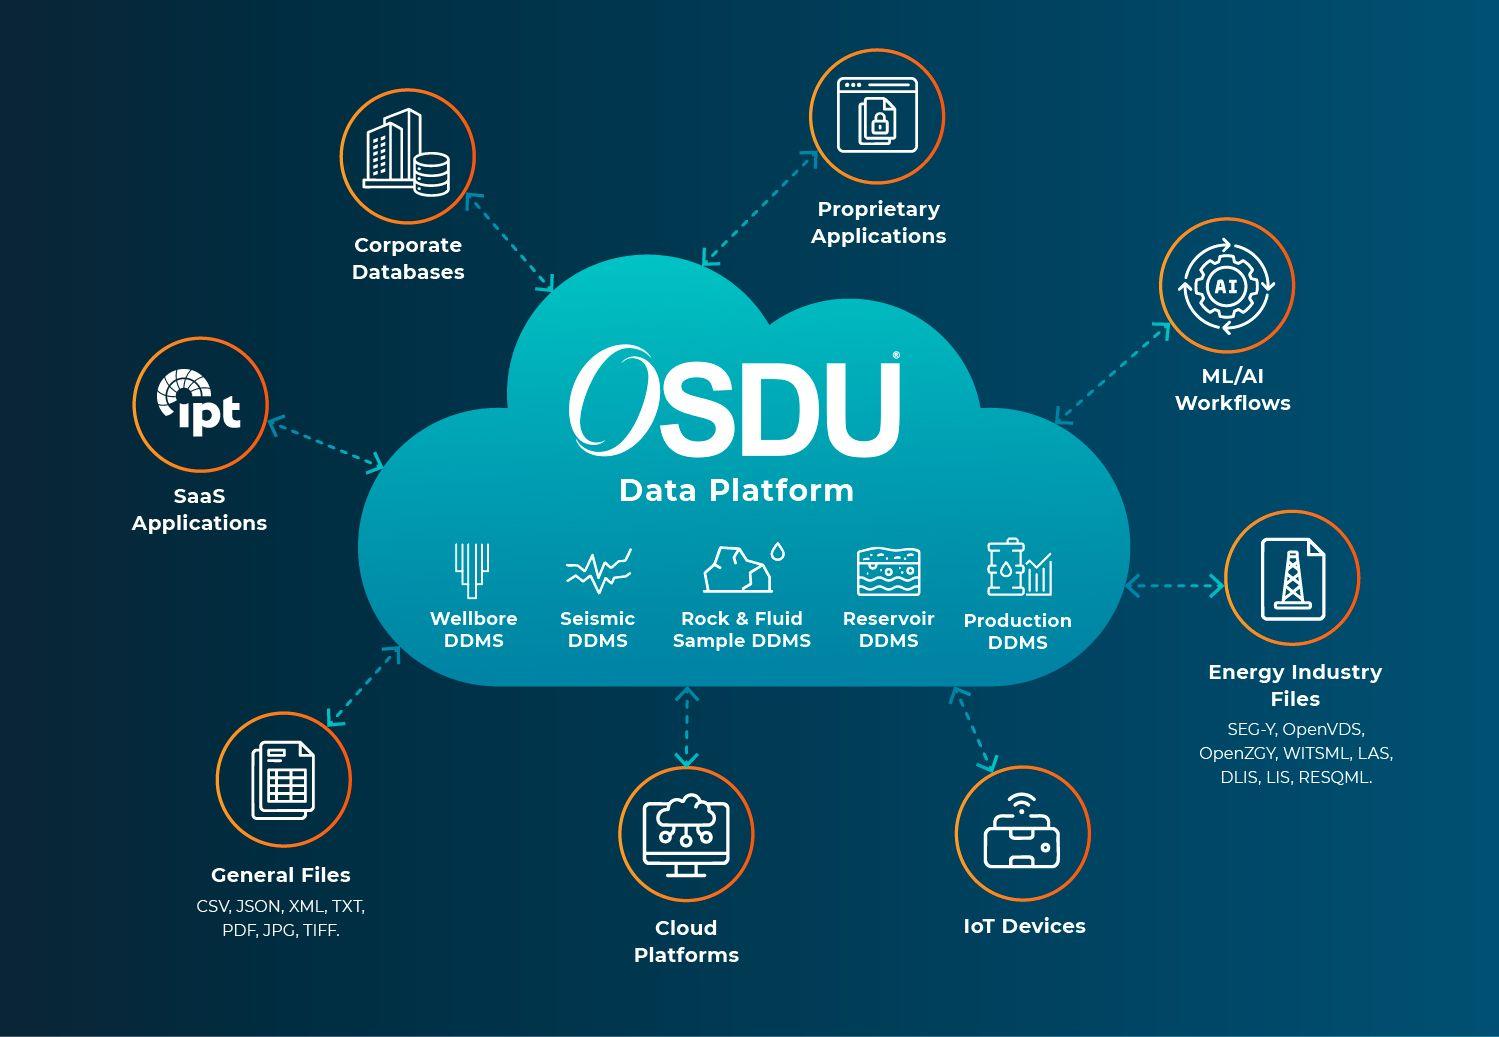
The OSDU Data Platform is an open-source, technology-agnostic environment created to eliminate silos and establish a single source of truth for subsurface, well, and operational data.
By providing a secure, scalable foundation, the framework makes information more accessible to operators, service companies, and regulators. This integration drives collaboration, speeds decision-making, and enables advanced digital solutions at scale.
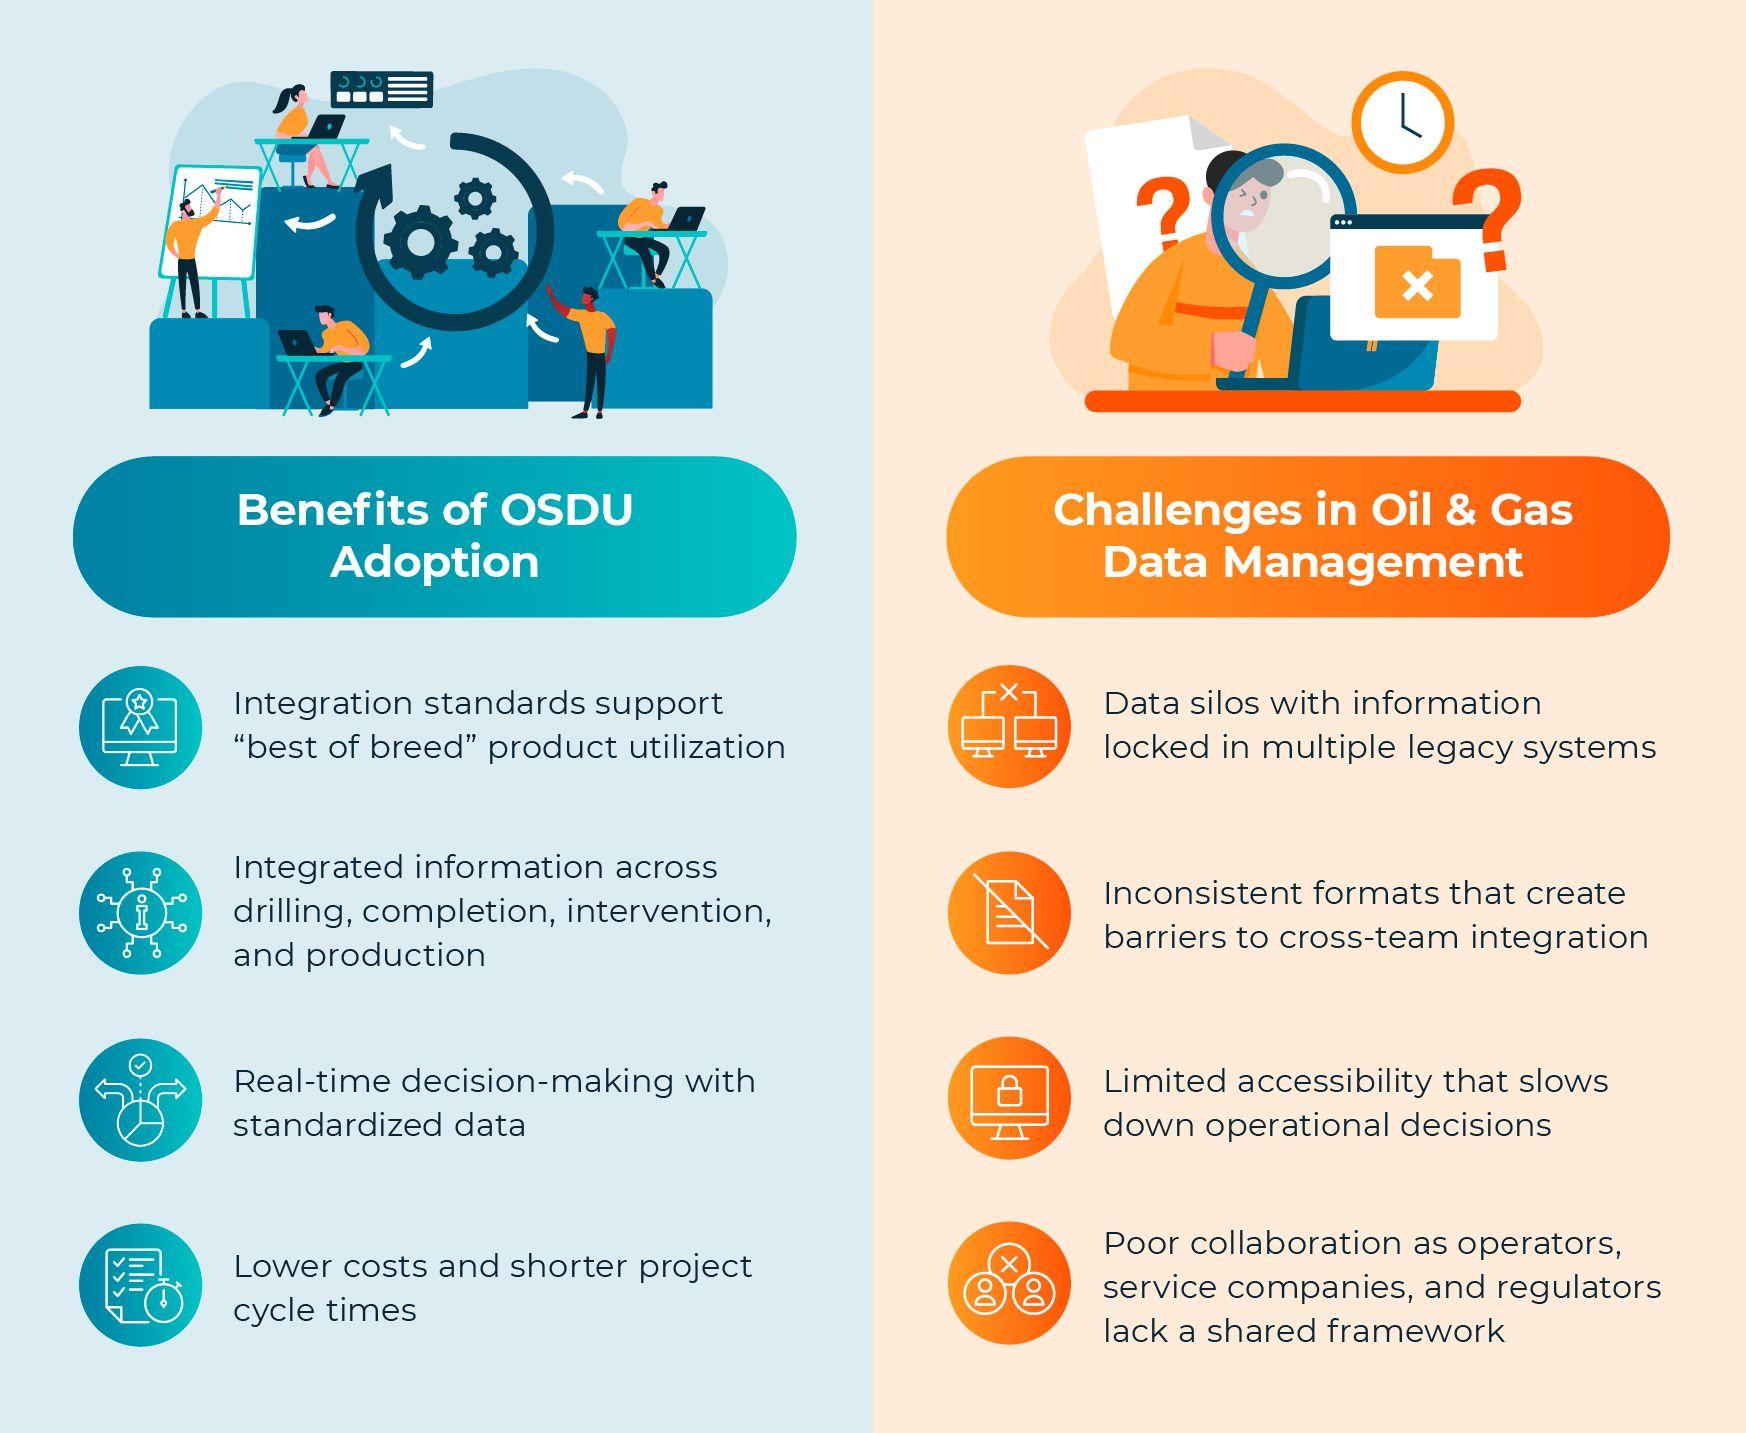
Oil and gas companies face persistent data management challenges, including siloed information, inconsistent formats, limited accessibility, and difficulties collaborating across operators, service companies, and regulators.
The OSDU data platform addresses these challenges by providing standardized frameworks and integration across workflows. Adoption of OSDU enables better data accessibility, faster decision making, lower costs, and a foundation for advanced analytics like AI and machine learning.
The strength of OSDU lies in its reference architecture and standardized data schema. These define how subsurface and operational information is structured, ensuring it can flow seamlessly between different software and workflows.
At IPT Global, we actively contribute to this effort. Our teams have shaped the schemas for Well Barrier Element (WBE) and Well Control Equipment (WCE) Pressure Tests and Well Schematic Diagrams, which are now part of the OSDU reference implementation. This work standardizes well integrity data and contextualizes it for use across drilling, completion, and abandonment workflows.
By working within the OSDU architecture, IPT Global eliminates inefficiencies of custom integrations and positions data for advanced analytics and automation.
As an active member of the OSDU Forum, IPT Global collaborates with industry leaders, technology providers, and regulators to advance open data standards. Together with other OSDU members, we contribute expertise in well assurance, pressure testing, wellbore schematics and barrier management to shape how operational data is stored and exchanged.
This role delivers IPT Global clients access to data models designed with real-world assurance workflows in mind, allowing them to adopt OSDU more efficiently and with greater value.
Our standards-based approach extends into IPT Global technology. Through secure application programming interfaces (APIs), we integrate well data, incorporate pressure test results, and connect with cloud-based data lakes. Built on service bus architecture, these integrations deliver information that is consistent, traceable, and actionable across planning, execution, and real-time operations.
By aligning our well integrity and barrier management solutions with the OSDU platform, IPT Global makes assurance data practical and accessible across day-to-day workflows.
The OSDU standard is transforming how oil and gas companies manage and use operational data. By replacing fragmented systems with a unified platform, operators can unlock greater value from their information and more effectively adopt advanced digital technologies.
At IPT Global, we put these standards into action. From structuring assurance data and standardizing formatting to embedding well integrity information into daily workflows, we provide the expertise and tools for end-to-end assurance.
Artificial intelligence (AI) is transforming oil and gas operations by enhancing efficiency, improving decision-making, and reducing risks. However, the success of AI applications depends on high-quality, well-managed data. Preparing data for AI analysis requires strategic planning and adherence to best practices to ensure data is accurate, complete, and suitable for complex AI models. Here are key best practices that companies should adopt to ensure their data is ready for AI applications.
In the oil and gas industry, various data formats can hinder AI applications, which thrive on consistency. Implementing standardized data schemas and company-wide data exchange protocols (e.g., WITSML, PRODML) ensures data is uniform and interoperable, making it easier for AI systems to analyze. Standardization simplifies pre-processing for AI and enhances compatibility.
AI algorithms need comprehensive and accurate data to provide meaningful insights into oil and gas operations. Fragmented or missing data can reduce the reliability of AI applications. A key step in ensuring data integrity is conducting routine data audits to catch missing, duplicated, or inaccurate records. These audits can identify and address incomplete or inaccurate data sets that could otherwise distort AI models and lead to faulty conclusions.
Data governance defines who is responsible for managing data, how it is accessed, and how it is protected. Strong governance ensures compliance with industry standards and protects sensitive information. Achieving AI readiness requires a solid governance framework to securely manage data collection, storage, and access. Establish a dedicated data governance team to oversee roles, responsibilities, and data access controls, ensuring secure and consistent data management practices.
A data lake is a centralized repository for storing raw historical and real-time data in its native format until it’s needed for analysis, without requiring prior structuring or processing. The oil and gas industry generates large volumes of structured and unstructured data, such as seismic data, well logs, production information, and well integrity test data. While structured data is well-organized and easy to search, unstructured data is less organized, making it harder to analyze using traditional methods. To address this, companies should leverage cloud-based data lakes to centralize data storage in its raw form, enabling AI models to more easily access and process data from various sources.
Supervised learning is a machine learning approach where an AI model is trained using a labeled dataset, which includes both inputs and corresponding known outputs (labels). For example, if images of cars and planes are the input, the output label would specify whether it’s a “car” or “plane.” The model’s goal is to learn patterns between the inputs and outputs to accurately predict outcomes for new, unseen data.
In the case of a predictive maintenance model for offshore rigs, labeled data is required to indicate whether equipment is in good or bad condition. Without proper labeling, AI predictions will be compromised.
To enhance the precision of AI models, companies should invest in both manual and automated data labeling processes to improve the accuracy of AI-driven models.
Protecting AI-ready oil and gas data from breaches or unauthorized access is a top priority, considering the strategic importance of operational and geological data, and the critical nature of the business. Robust security measures, including encryption and access controls, are critical for maintaining the integrity of data used in AI applications. Companies must ensure their data security protocols are up-to-date and capable of protecting not only existing datasets but also the increasing volumes of data that future AI applications will depend on.
The volume of data used in oil and gas AI applications is constantly expanding. As AI adoption grows, so will the demands on data storage, processing power, and bandwidth. Being AI-ready means ensuring that your data infrastructure can scale with the volume and complexity of data. By leveraging scalable cloud solutions, companies can manage growing data volumes while maintaining the flexibility to adapt to evolving AI requirements.
Oil and gas companies can position themselves for AI success by standardizing data formats, ensuring data completeness and accuracy, implementing strong governance, and utilizing scalable cloud solutions. For more information on preparing your well integrity data for AI, contact us today.
A widely accepted definition of well integrity is “the application of technical, operational, and organizational solutions to reduce risk of uncontrolled release of formation fluids throughout the lifecycle of a well”. Technical solutions refers to the physical well barriers that contain pressure and hydrocarbons. The failure of a well barrier compromises well integrity, resulting in loss of production and harm to personnel, environment, assets, and the operator’s reputation. Operational and organizational solutions include the planning, design, guidelines, and procedures that help achieve and maintain well integrity.
A well barrier is often referred to as an envelope consisting of one or more well barrier elements (WBEs). Examples of WBEs include drilling fluid, BOPs, the wellhead, casing, cement, packers, and other well components. The failure of a single WBE can cause the well barrier envelope to fail. For wells that are capable of sustained flow to the wellhead, the oil and gas (O&G) industry uses two barrier envelopes—primary and secondary—for a high level of reliability.
The primary barrier envelope consists of WBEs that are, or might be, in direct contact with well pressure to prevent unintentional flow of reservoir fluid to surface or another zone. The secondary barrier envelope consists of barrier elements that are, or might be, exposed to contact with well pressure should any primary barrier element fail.
Think of the primary barrier envelope as being inside the secondary barrier envelope. If an element that is part of the primary barrier envelope fails, the elements in the secondary envelope must prevent the release of reservoir fluid to the surface or to another zone.
The primary and secondary barrier envelopes change as wells progress through lifecycle phases, as shown in the table below. For example, the primary barrier envelope during drilling operations is the overbalance hydrostatic pressure from the drilling fluid, but during production the primary barrier envelope includes the casing, cement, production tubing, packers, and downhole safety valves. This is why it’s important for operators to have clear and accurate well barrier diagrams to help all stakeholders visualize changes to well barriers and assess risk over the life of a well.
| WELL LIFECYCLE | PRIMARY BARRIER ENVELOPE | SECONDARY BARRIER ENVELOPE |
|---|---|---|
| Drilling | • Drilling fluids • Completion fluids |
• Casing cement • Casing • Wellhead • BOP |
| Production | • Casing cement • Casing • Packer • Tubing • Downhole safety valve |
• Casing cement • Casing • Wellhead • Tubing hanger • Christmas tree |
| Intervention | • Casing cement • Casing • Deep-set plug • Overbalanced mud |
• Casing cement • Casing • Wellhead • BOP |
| Plug & Abandonment (P&A) | • Casing cement • Casing • Cement plug |
• Casing cement • Casing • Cement plug |
With every well, there are challenges to assessing risks to well integrity. Well conditions change and there are multiple ways that well barriers can fail.
Challenges to Well Barrier Integrity
Wells are initially designed and constructed based on certain criteria. However, a well’s operating conditions or utilization may change during its lifecycle, adversely affecting the integrity of critical WBEs. For example, during the life of a well:
Any one or a combination of the above events can diminish the integrity of individual WBEs. Therefore, an effective well integrity management program is needed to validate the integrity of the WBEs to operating conditions that may be different from the original assumptions when the well was drilled.
Potential Hazards
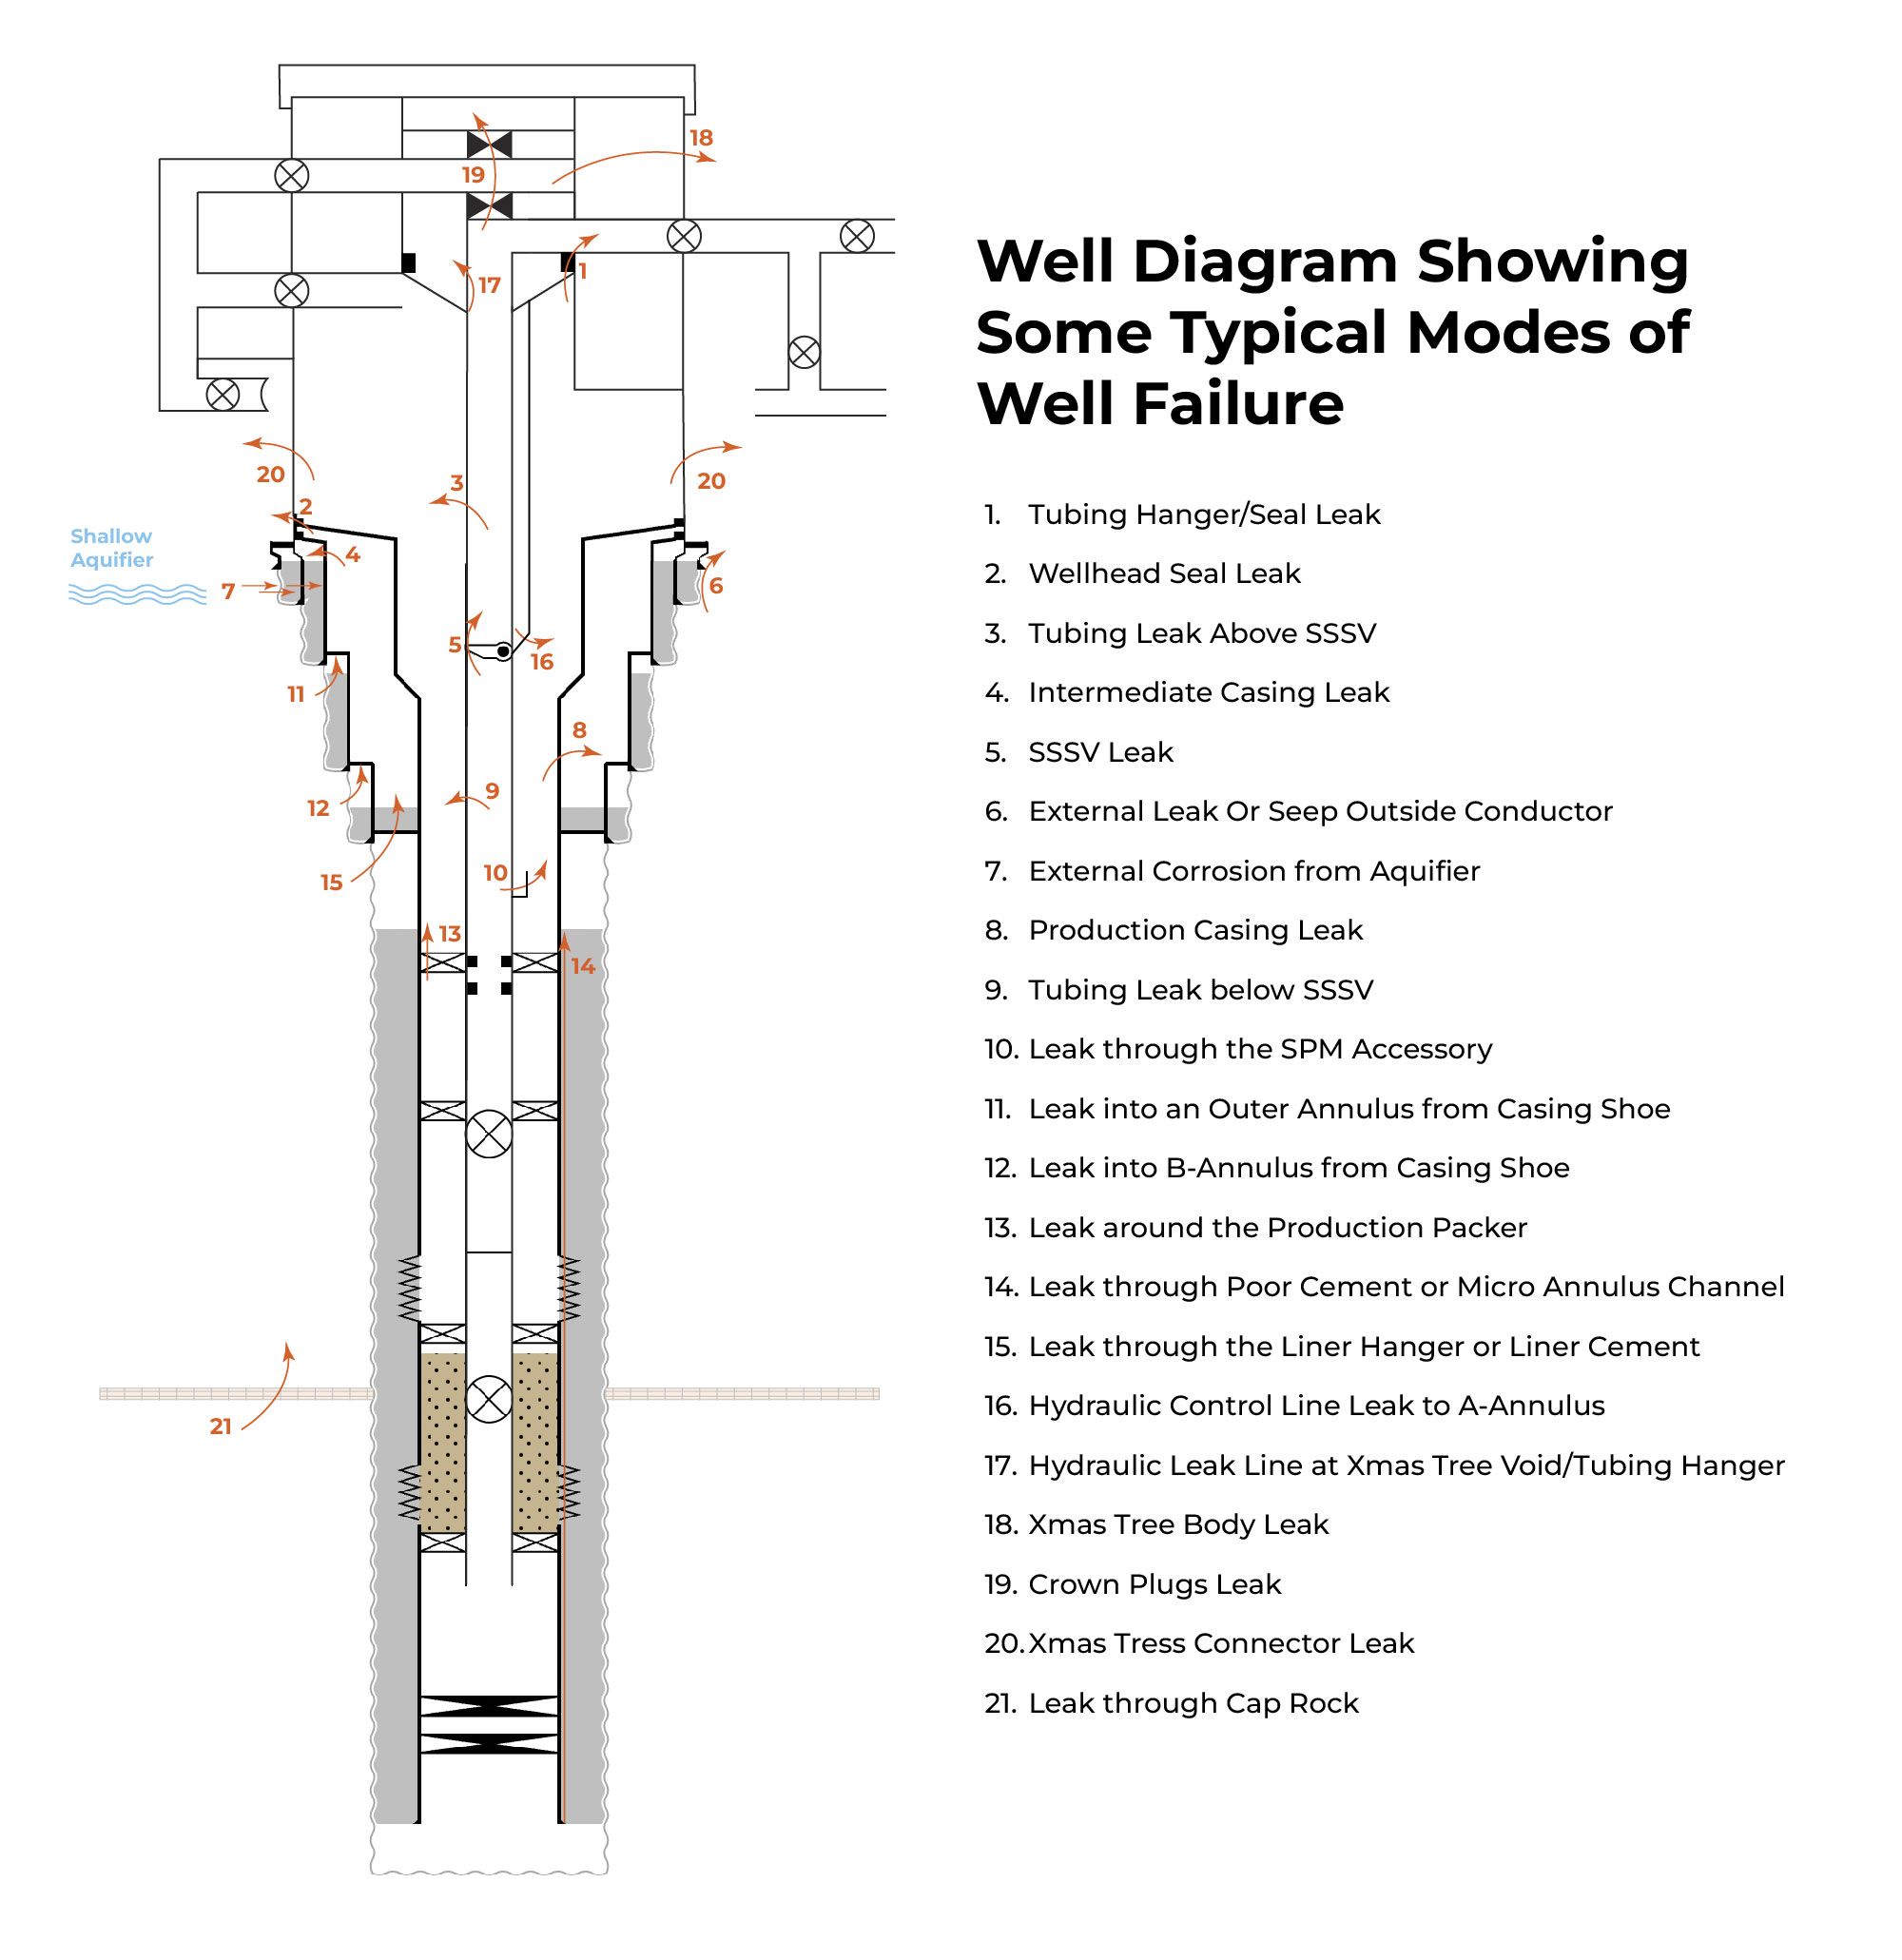
Well barrier elements can experience leak paths due to mechanical stresses, temperature changes, and exposure to corrosive substances. The figure below shows some of the potential leak paths in WBEs.
Strategies for Mitigating Risks to Well Barrier Integrity
Here are some strategies for mitigating risks to well barrier integrity:
Regulatory Compliance and Standards
International industry associations and standardization organizations have issued the following standards, guidelines, and recommended practices related to well integrity.
API STD 53, 4th Edition, Jan 2012
“Blowout Prevention Equipment System for Drilling” is a standard that provides requirements for the installation and testing of blowout prevention equipment (BOP) systems on land and marine drilling rigs.
API RP 96, 1st Edition, Jan 2013
“Deepwater Well Design and Construction” is a recommended practice (RP) that aims to improve safety and reduce the chance of losing well control or damaging the environment. It includes considerations for barrier and load cases. This RP is based on the complexity of deepwater operations, which requires a thorough understanding of well design criteria and the equipment associated with them.
NORSOK D-010 Revs 4, Jun 2013
“Guidelines for Well Integrity in Drilling Well Operations” is the Norwegian O&G industry standard that defines the minimum functional and performance requirements for well barriers throughout a well’s lifecycle. The standard focuses on how to conduct operations and what equipment should be used and is concerned with drilling, completion, and abandonment activities.
ISO/DIS 16530-1, 2017
“Well Integrity – Lifecycle governance” offers guidance to well operators on managing well integrity throughout the well’s lifecycle. It is intended for use in the petroleum and natural gas industries worldwide and applies to all wells regardless of their age, location, or type. This part of ISO 16530 addresses the minimum compliance requirements for well operators to claim conformity with this part of ISO 16530. The document addresses each stage of the well lifecycle, as defined by six phases: the basis of design, design, construction, operation, intervention, and abandonment.
Well schematics and well barrier diagrams are two distinct methods of illustrating WBEs and their role in integrity management. Each method has its specific applications, contributing to a comprehensive understanding of well integrity management strategies.
Well Schematics
A well schematic is an illustration that shows the arrangement of the main WBEs within the well system. The schematic typically includes well and location information, annotations that describe the lithology, depths of the casing and cement sections, descriptions of the major WBEs, mud weights, and formation temperatures.
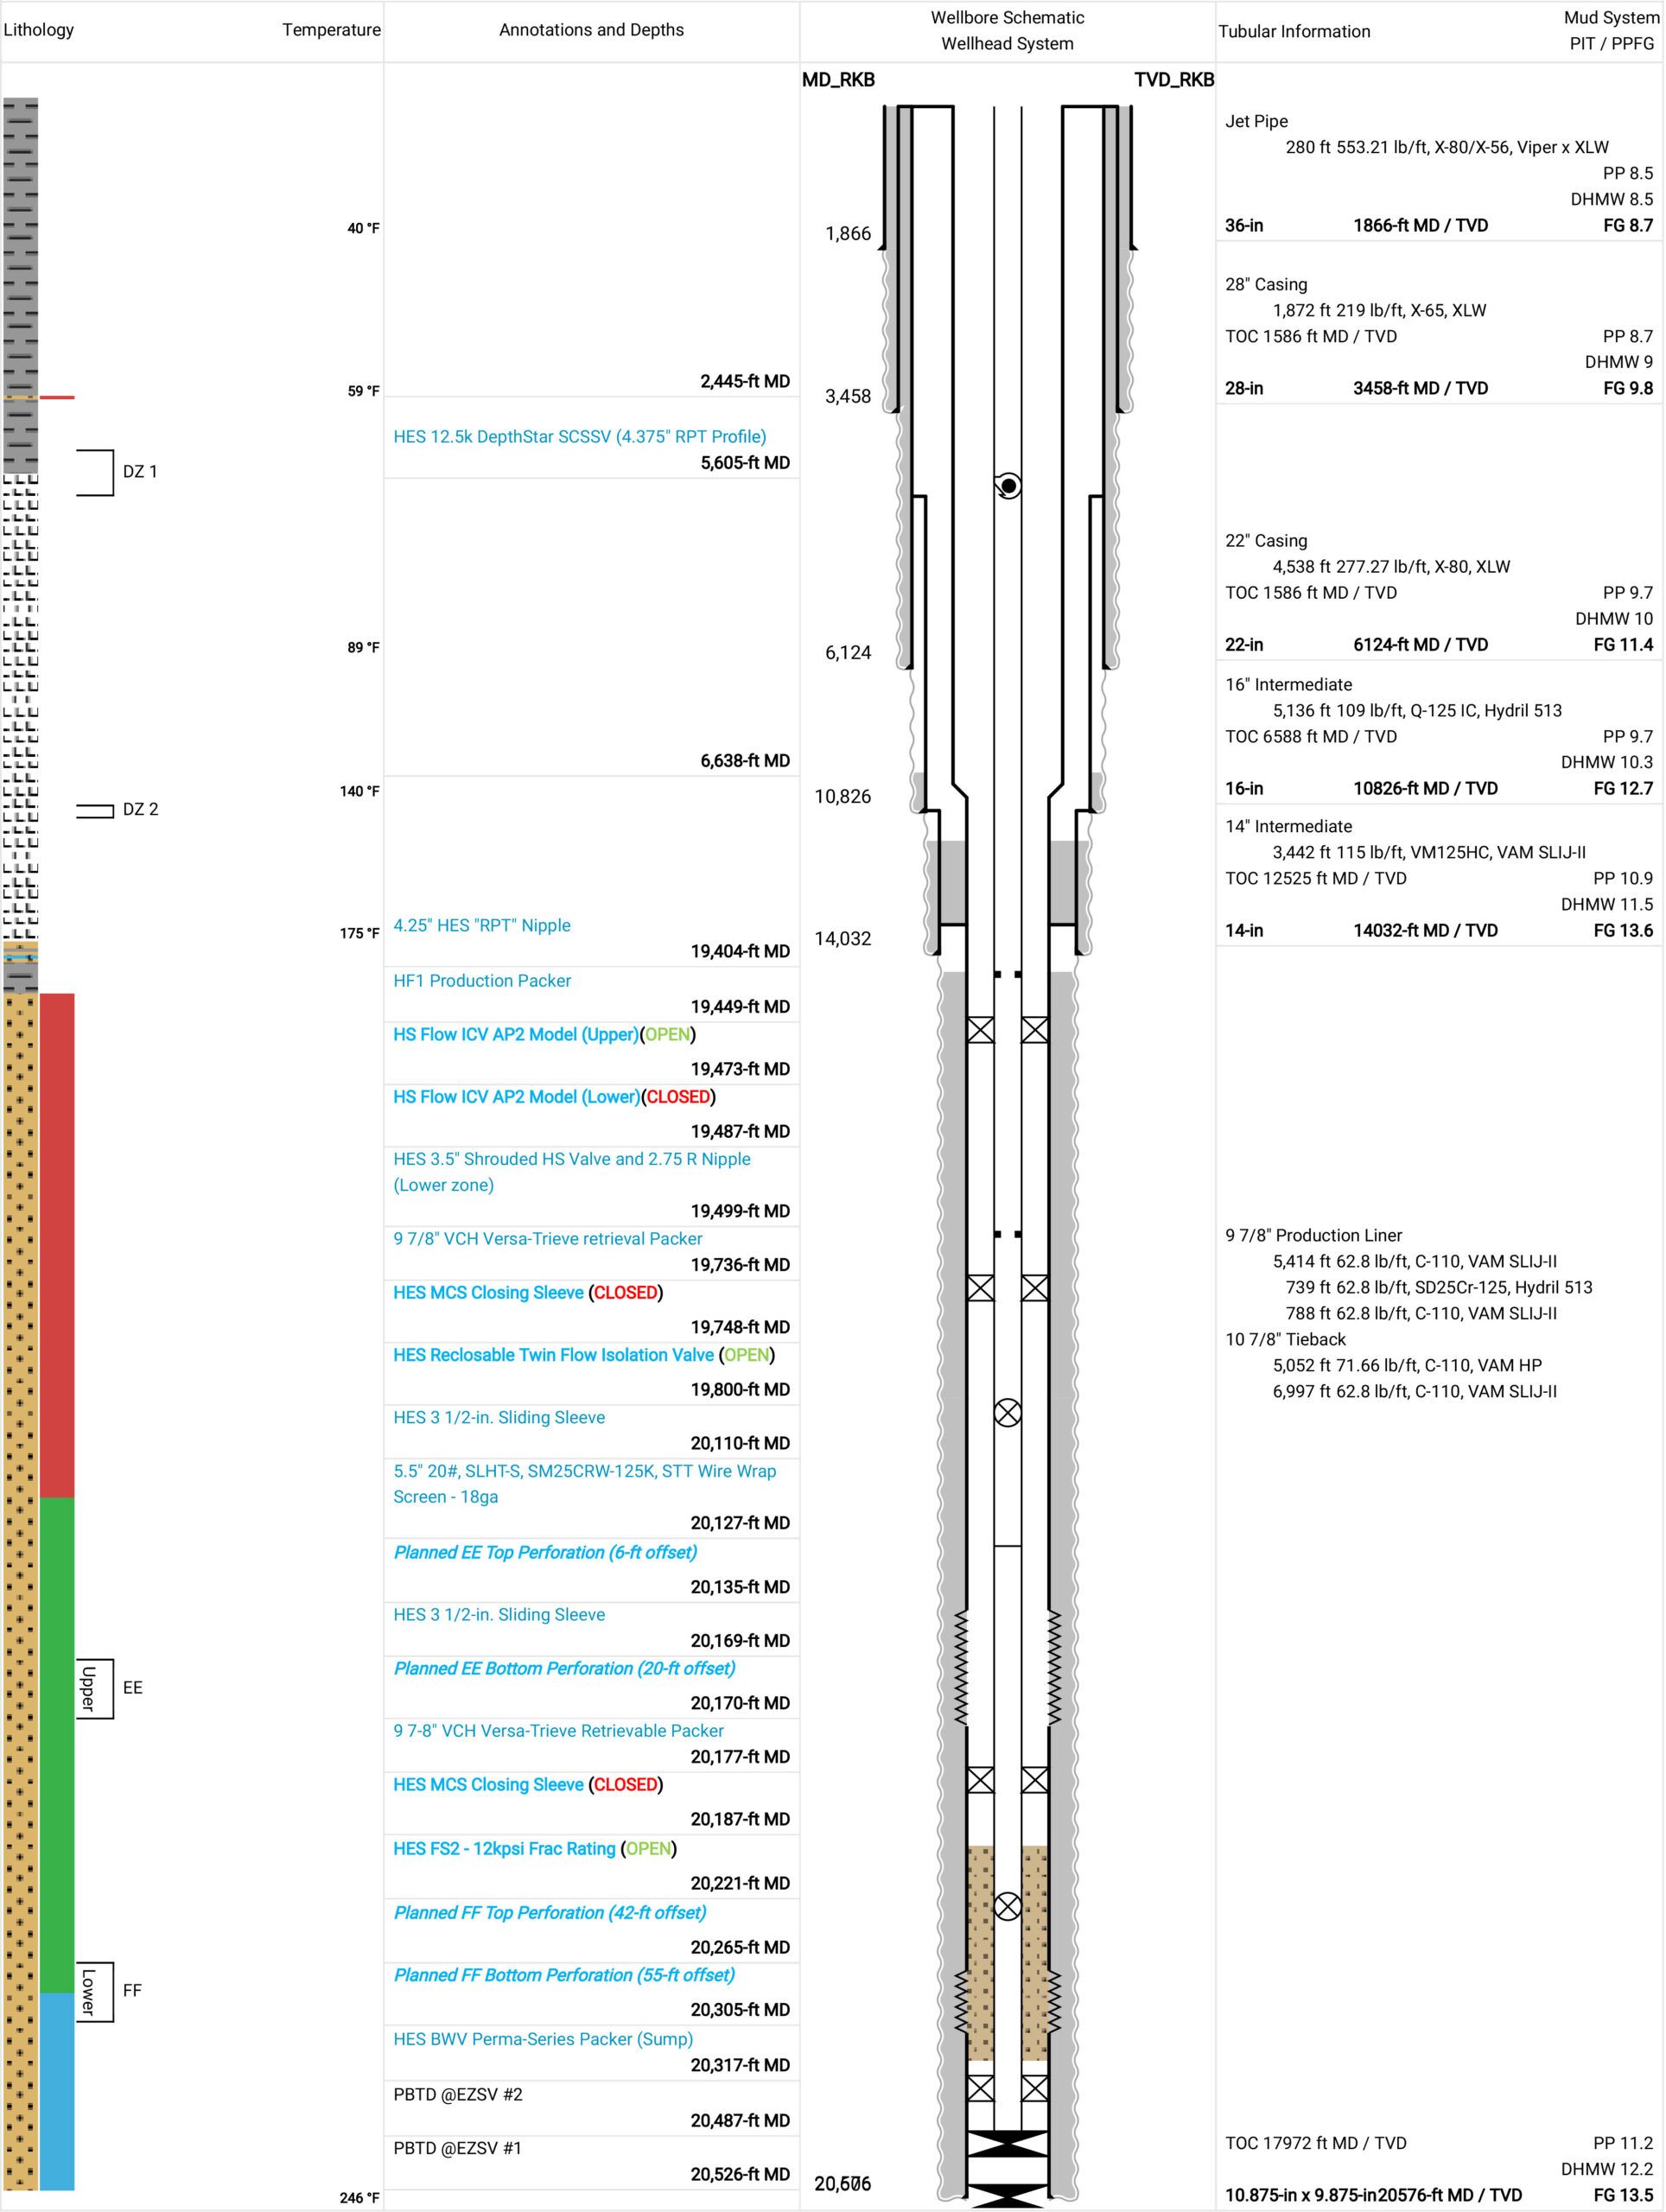
For years, engineers have used various applications to create well schematics, including spreadsheets, word processors, CAD programs, and other planning tools. This has resulted in duplicate data entry with increased potential for errors, change management challenges, and communication and workflow issues during handovers between well phases. Digital well schematic software like IPT Global’s SureTec® WellSchematic allows engineers to build well schematics with barrier diagrams in a centralized Cloud-based repository that tracks the location and information about each WBE in every well.
IPT Global’s digital WellSchematic solution provides several benefits:
Well Barrier Diagrams
Well barrier diagrams display color-coded primary and secondary barrier envelopes and may illustrate all potential leak paths from the reservoir to the surrounding environment. These diagrams describe the status of barrier elements and are valuable for evaluating the consequences and likelihood of specific scenarios. Well barrier diagrams quantify the likelihood of consequences depicted in the diagram, making them useful for risk assessment and decision-making.
Digital well barrier diagram technologies like IPT Global’s WellSchematic BarrierManagement module provide some of the same benefits as digital well schematics, plus:
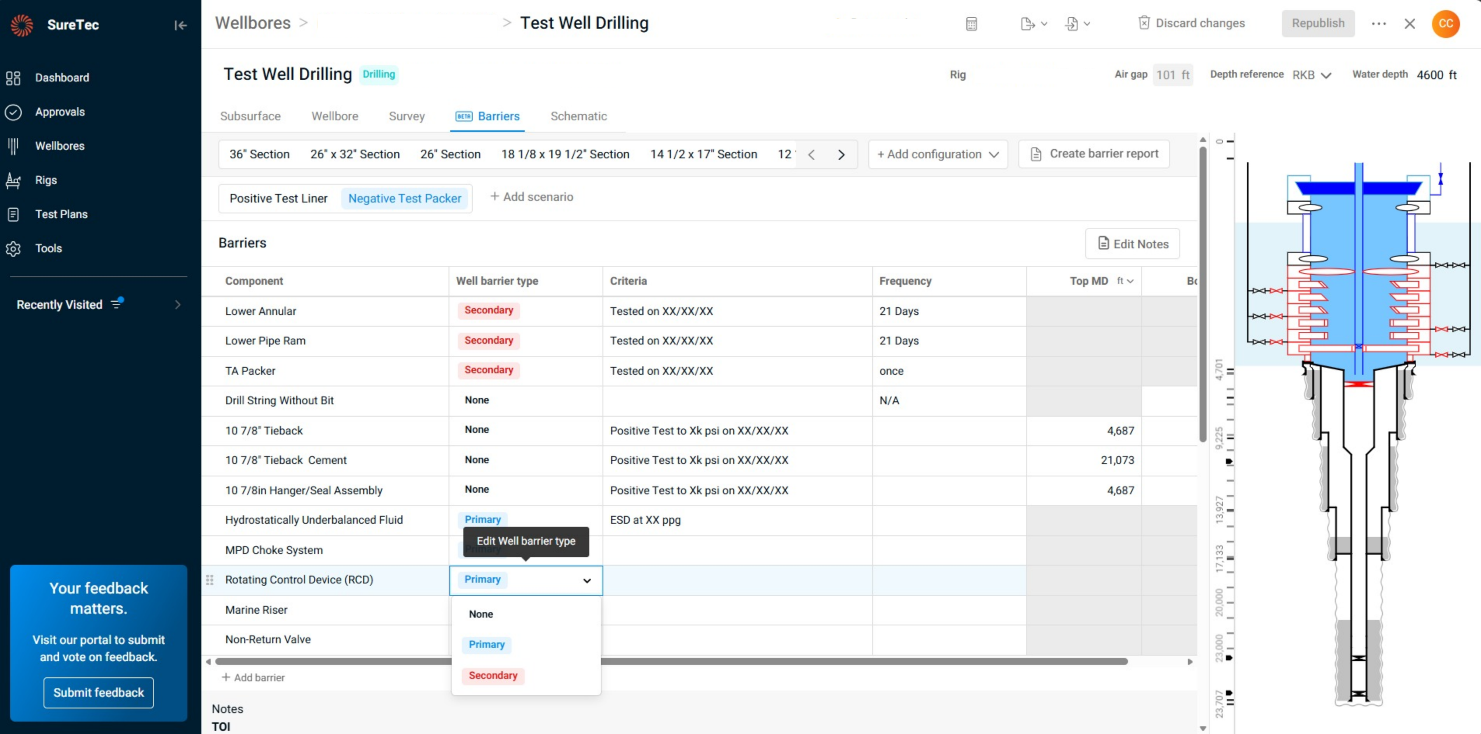
IPT Global’s well barrier management tool for building barrier diagrams and plans
The development of well integrity software applications and associated technologies has accelerated since 2010, with the increased digitization of the O&G industry after several catastrophic incidents.
Well integrity software applications define the commitments, requirements, and responsibilities of an organization to ensure the integrity and safety of oil and gas wells throughout their lifecycle. The primary aim is to mitigate the risks associated with uncontrolled releases of formation fluids, which can lead to environmental harm, injuries, and financial losses. This is achieved by identifying potential integrity threats, implementing preventive measures, and regularly monitoring well conditions to prevent leaks or failures.
IPT Global offers rigorous well integrity software through its SureTec platform, as well as expert advisory services for advanced well integrity management at every stage of the well lifecycle. SureTec includes solutions for constructing detailed wellbore schematics, the foundation for barrier schematics and test plans. These generate comprehensive test plan reports documenting every surface and subsea WBE to be tested. IPT Global’s integrity tests leverage proprietary algorithms that significantly reduce pressurized time for testing WBEs and remove validation subjectivity, saving rig time and reducing risk. Additionally, IPT Global’s well assurance solutions allow collaboration and handover among teams, while tracking all changes and maintaining versions over the complete lifecycle of wells. Moreover, our expert advisors are available to support the process wherever required, whether onsite or remotely. With decades of experience, they excel in generating and optimizing integrity test plans, while offering expert assistance before, during, and after testing operations, regardless of geographic location.
Well barrier envelopes only stay reliable when the people managing them can see what’s actually in the well and confirm those barriers are working as intended. SureTec WellSchematic gives operators that visibility, from the wellbore diagram itself through the barrier plans built in BarrierManagement, so nothing gets tracked in scattered spreadsheets or outdated files. Ready to see how it works for your wells? Contact IPT Global today
A wellbore diagram, or well schematic, provides a visual representation of the well and its components at any phase of the well lifecycle. It can also serve as a valuable tool to aid in the planning and execution of well operations, from drilling and completions to interventions and abandonment.
The detailed graphical information in wellbore schematics display the size (diameter) and length of major components and the depth at which the components are located.
Wellbore diagrams are a critical communication tool for all stakeholders and decision makers. Wellbore diagram programs should have key features like version control and collaboration capabilities to effectively handle risk management and change control. Wellbore schematics also need to be dynamic to track changes over the lifecycle of the well so that data is up-to-date and available on demand. IPT Global’s SureTec® WellSchematic solution is built around these needs, keeping schematics current and accessible across global operations teams.
The importance of wellbore diagrams cannot be overstated. Over the lifecycle of a well, wellbore diagrams are used for:
In the planning phase, operators and engineers utilize wellbore schematics to visualize design alternatives for the intended well. This aids in the safe and efficient delivery of both the well and the associated business objectives.
When integrated with drilling data acquisition software, wellbore diagrams can be used to communicate operational progress against the plan.
A wellbore diagram assists engineers in overseeing well barriers and assessing risks, as well as making informed decisions regarding the final positioning of casing strings, production tubing, and other completions equipment. It also influences decisions about future completions opportunities.
Coupled with actual well performance and production rate data, wellbore diagrams can help to identify potential production challenges and risks associated with well integrity issues.
Frequently updated wellbore diagrams streamline the decision-making process for well interventions and maintenance, serving as a valuable risk management tool to effectively handle well barrier management for interventions.
As a well reaches the end of its lifecycle, wellbore diagrams play a pivotal role in guiding the placement of cement plugs and other well barriers, ensuring the effective prevention of leaks and environmental contamination. This compliance with policy and regulatory requirements is essential, especially during the well abandonment or plug and abandonment process.
Wellbore diagrams differ in appearance but typically contain these components and symbols.
| Component | Description / Symbol |
|---|---|
| General information | Operator, lease name, well number, rig name, legal location, API number, latitude and longitude, date updated |
| Symbol: Displayed at top of schematic | |
| Elevation | Rotary Kelly Bushing (RKB), Mudline (ML), water depth |
| Symbol: Elevation value located at top of the schematic | |
| TD & PBTD | Total Depth of hole and Plugged Back Total Depth |
| Symbol: Values displayed at bottom of schematic | |
| Hole sections | Diameter, top of measured depth, and measured depth |
| Symbol: Vertical or horizontal dashed lines | |
| Casing | Size, weight, top measured depth (TMD), bottom measured depth (BMD), top of cement (TOC) |
| Symbol: Vertical lines representing different casing strings in the wellbore | |
| Cement | Top and bottom of cement, type of cement, yield, and slurry weight |
| Symbol: A shaded area around the casing strings indicating the extent of cement placement | |
| Wellbore components | Packers, plugs, valves, tubing, and gas mandrels |
| Symbol: A rectangle across the wellbore placed at a specific depth | |
| Completion components | Tubing hangers, gauges, production tubing, downhole safety valve, side pocket mandrel, slotted liner, landing nipple, etc. |
| Perforation depth | The location of perforations as defined by top measured depth (TMD) and bottom measured depth (BMD) |
| Symbol: Small, vertically aligned dots or short lines along the casing or tubing | |
| Liner | Size, weight, top measured depth (TMD), bottom measured depth (BMD), top of cement (TOC) |
| Symbol: Vertical lines inside the casing but not extending to the surface | |
| Lithology column | Vertical representation of formations encountered as the well is drilled |
| Symbol: Shading or patterns that distinguish one formation from another | |
| Formation tops | The upper boundary of geological formations |
| Symbol: A horizontal line with the name of the formation indicates the top boundary of a specific geological layer | |
| Geological symbols | Marks that represent geological features such as faults, unconformities, anticlines, and synclines |
| Symbol: A jagged or wavy line intersecting the wellbore trajectory | |
| Drilling fluid | Mud density, viscosity, formation pressures, temperature, etc. |
| Perforations | Top, bottom, shots per foot, and phasing angle |
| Symbol: open (green) and squeezed (red) | |
| Wellbore trajectory | Wellbore path from surface to target depth expressed in terms of measured depth, inclination, and azimuth angles |
| Symbol: An arrow or curve along the wellbore trajectory shows the direction and angle of deviation during directional drilling |
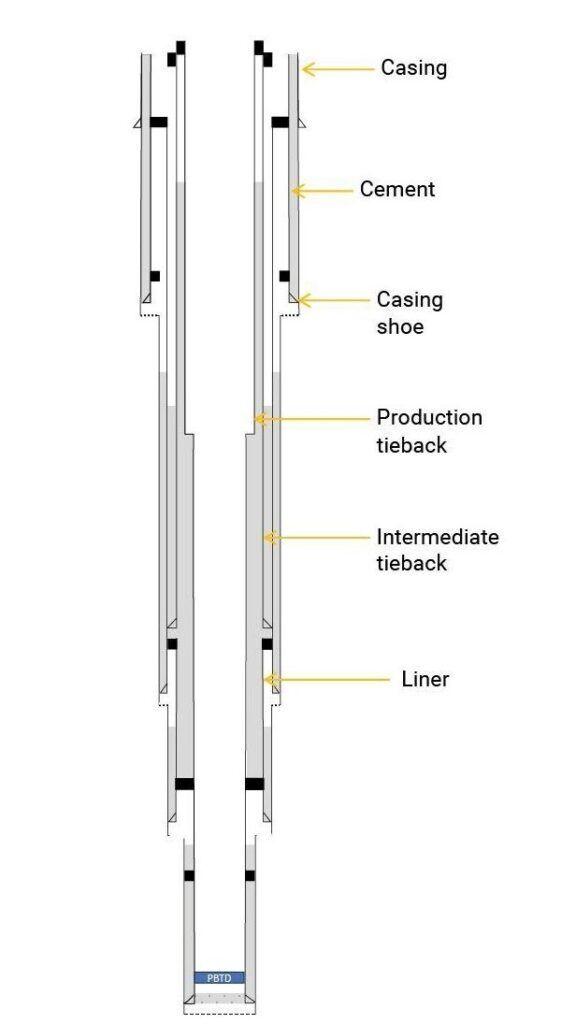
Casing provides structural support to the well and acts as a physical barrier to prevent fluid migration. The casing string consists of casing sections that decrease in diameter with depth. Casing setting points are adjusted to specific depths, for a particular hole diameter. The casing string is run into the wellbore and cemented into place to ensure proper zonal isolation and guarantee impermeable barrier between different formation zones. Casing is often represented in wellbore diagrams using vertical lines to denote different casing sections from the wellhead to the casing shoe. Liners are casing strings that normally run and set within the wellbore and typically do not extend all the way to the wellhead.
Cement is used to create a barrier between the wellbore and the surrounding rock formations. During well construction, the annular space between the casing and the formation is filled with cement. The cement sheath forms a mechanical and hydraulic barrier, preventing fluid migration along the outside of the casing. Cement is depicted in wellbore diagrams by shaded areas that correspond to the depth range where the cement is placed.
A production tieback is typically connected to the top of the production liner or casing string that runs across the production reservoir interval. The primary purpose of a production tieback is to provide a conduit for the flow of hydrocarbons from the reservoir to the surface.
An intermediate tieback is used to isolate a casing string that cannot withstand possible pressure loads during drilling, usually because of excessive wear or higher-than-anticipated pressures. In some cases, intermediate tiebacks may not connect directly to the top of a liner. Instead, they are typically set at a shallower depth and cemented separately from the production liner.
Subsurface formation boundaries and geological features can be accurately represented in wellbore diagrams to clearly indicate the geological formations encountered at various depths or hole sections. This helps drilling teams understand the lithology and potential reservoir characteristics.
Formations are separated by upper and lower boundaries where the rock lithology changes. Subsurface formation data, such as seismic surveys, core samples, and well logs help geologists, drilling engineers, and reservoir engineers accurately place the wellbore in the most favorable locations to optimize drilling efficiency, minimize drilling risks, and optimize future production.
Formation tops represent the upper boundaries of specific geological formation classifications, such as chalk, limestone, shale, and sandstone. They are typically marked with horizontal lines or notches on the lithology column. Formation tops are labeled with the names of the formations they represent and provide valuable information about the depth at which the different formations are encountered.
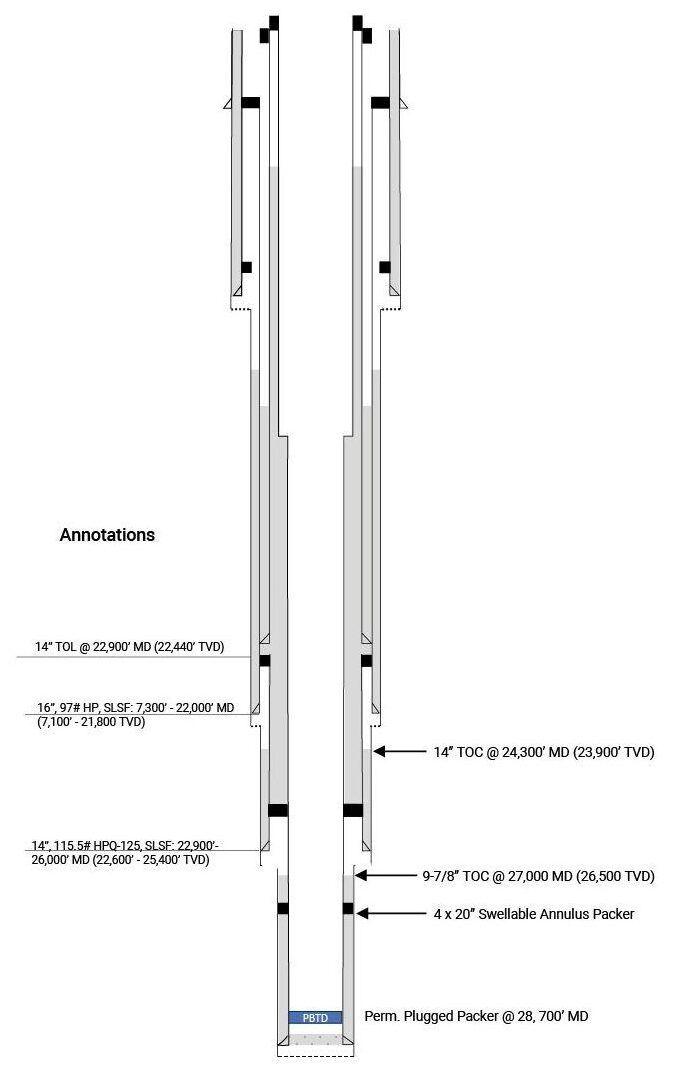
Annotations and labels provide additional information about the formations, features, and wellbore components. They can explain lithology and provide context for significant geological events, seismic characteristics, and more details about wellbore components.
A completions wellbore diagram is a visual representation of the components and configuration of the completions equipment within an oil or gas well. It provides a clear and comprehensive overview of how the well is equipped for production, including the arrangement of tubing, casing, packers, and other wellbore elements. It also serves as a detailed record of the completions design and completions equipment (jewelries) configuration for future reference, maintenance, and regulatory compliance.
The completions diagram is typically accompanied by detailed annotations, specifications, and a legend to explain the symbols and components used. It serves as a critical reference document for well operators, production engineers, and maintenance teams throughout the well’s lifecycle.
IPT Global’s WellSchematic solution and other software used to create wellbore schematics typically contain a range of features and functionalities designed to provide a comprehensive and detailed representation of the wellbore.
| Feature | Description |
|---|---|
| Wellbore visualization | Visual display of the wellbore |
| Casing and tubing strings | Generate casing and tubing sections of different sizes (diameter and thickness), depth, and cement sections |
| Deviations and doglegs | Ability to show any deviations or changes in trajectory during drilling |
| Formation tops | Geological data that indicate the depths of different formation tops encountered during drilling |
| Data integration | Integrates real-time data from drilling operations such as weight on bit (WOB), rate of penetration (ROP), and rotary speed |
| Completion equipment | Production tubing, packers, plugs, and downhole valves |
| Easy editing | Allows users to modify the wellbore path and components |
| Scale and measurements | Tools to measure and modify distances in angles on the wellbore diagram |
| Survey data | Measure depth, inclination, azimuth, vertical section, northing, easting, and readings at various depths |
| Exporting and reporting | Exporting the wellbore diagram in various formats for sharing with colleagues, regulatory authorities, or reports |
| Historical equipment tracking | Records changes to the well’s completion equipment over time |
| Version control | Documenting modifications to the wellbore as it progresses from drilling, completion and production to intervention and abandonment |
| Geothermal information | Captures Surface Ambient Temperature, Seabed/Mudline Temperature, and Formation Temperatures |
| Formation input / information | Comprises pore pressure data and fracture gradient data |
When using wellbore schematic software, accurate data entry, validation, and quality control are crucial to various aspects of safety, compliance, and overall well integrity. Inaccurate data entry can result in errors in well control decision-making, which increases safety risks to personnel, assets, and the environment. Erroneous data entries might result in redesigns, corrosion, collapses, or obstructions in the wellbore. For well operations that are subject to regulatory oversight, inaccurate wellbore schematics can lead to non-compliance, resulting in fines or other legal consequences. Inaccuracies could also lead to improper placement of critical wellbore elements, compromising the well’s structural integrity and potentially causing leaks or other problems over the life of the well. Using wellbore management diagram software with built-in validation checks and data consistency features can help reduce the risk of errors and assist in diagnostics if integrity or production issues arise.
As a well progresses from planning to drilling, completion, production, and abandonment, various wellbore modifications occur. It’s important to keep the wellbore diagram schematic up to date to reflect the specific state and configuration of the well at a given point in time, as well as store all changes that have taken place. Version control is fundamental to change-management processes.
Version control, or versioning, is the practice of documenting changes to wellbore diagrams over a well’s lifecycle to accurately reflect modifications during drilling, completion, workovers, interventions, and abandonment. Each version of the wellbore diagram reflects the specific state and configuration of the well at a given point in time, carrying significant implications for decision-making, regulatory adherence, troubleshooting, and collaboration. This becomes particularly crucial as the responsibility for the well transitions from one department to another throughout its lifespan. Incorporating well-defined approval signatories and technical authorities into the process is an essential requirement for ensuring well integrity.
Wellbore diagram applications have different forms of version control with the goal of a single source of truth. Some applications have project management features that enable users to track versions of wellbore diagrams while other applications may simply record edits and modifications made to a wellbore diagram. Other applications not only store previous wellbore diagram versions but also alert all relevant users when changes are made to a wellbore diagram so they can update it in their local repository.
Wellbore diagrams are indispensable tools in the oil and gas industry, contributing to the efficient and safe operation of wells. Their role in visualizing, documenting, and communicating wellbore information underscores their importance in every aspect of well management. To ensure successful well operations, it is crucial to adopt wellbore diagram software that makes creating wellbore schematics easy and maintains data accuracy and version control.
To learn how IPT Global’s WellSchematic solution—with barrier diagrams—can support your wellbore schematic needs, contact us today.
IPT Global’s expert advisory services and SureTec® software solutions came together to deliver value to all stakeholders during a well intervention program in Angola, off the west coast of Southern Africa. An intervention services company (ISC) took on an extensive program, with the goal of having its own personnel perform the integrity tests while relying on remote support from IPT Global, including our Field Advisors and Real-Time Operations Center (RTOC). The ISC wanted to demonstrate the ability to provide turnkey intervention services for various operators while performing the tests safely and efficiently to avoid costly non-productive time. IPT Global’s team worked with the ISC to create a custom operational support plan comprising in-house and on-site training, optimization of planning and test execution, and remote support.
IPT Global provided pre-deployment training at its office for the ISC’s engineers and managers. The training focused on using existing test plans to run tests and publish reports. Several variations of the test plans were run using existing schematics. IPT Global provided setup guides for the digital acquisition (DAQ) unit and transducers, along with quick start guides to run various tests in the SureTec platform. The participants were able to experience live data acquisition and testing scenario simulations, allowing them to become familiar with the PressureTesting with the workflows & procedures.
At the rig site, IPT Global’s Field Advisors trained intervention personnel so they could run SureTec PressureTesting with remote support from our RTOC. The training focused on using PressureTesting’s TestPlanner and TestEngine modules to guide testing efforts, leveraging the RTOC for remote support and publishing tests. IPT Global’s RTOC and engineers helped to manage the testing program with handover and record archival while transitioning between wells.
The operator planned 28 integrity tests, with specific criteria for each of the test types performed. IPT Global engineers created a test matrix for the ISC that included the operator’s criteria and a procedural reference for each test, making review and approval easier. The SureTec TestPlanner matrix also helped ISC personnel manage the testing program by making it easier to locate and run previously built test plans on the testing laptop. This allowed the company to focus on their operations and setting up the hardware rather than having to set up each test plan.
Completed tests and reports were saved in the SureTec platform for archival and traceability. The SureTec Platform is a secure, web-based tool that also provides real-time status of pressure tests, test data organization and retrieval by well and date, advanced data analysis, and remote viewing of active tests.
The ISC received remote support from IPT Global’s RTOC, which is staffed by experienced engineers and advisors who monitor all pressure tests 24/7 and provide global technical support. Remote support ranges from assisting with data connections, networking issues, and basic software issues to advanced support such as:
The intervention program required 28 integrity tests with various operator criteria to be performed over a relatively short period. The ISC successfully executed the intervention program and achieved its primary goal of providing turnkey service with digital software and remote support from IPT Global.
SureTec’s PressureTesting solution provided accuracy, objectivity, and flexibility that assured the integrity of all tested components according to the operator’s criteria. Our engineers performed post-test reviews to ensure all components were tested to the proper pressure as dictated by the operator. And IPT Global field advisors verified that test reports were published properly to assure the traceability of all integrity tests for hand-off to the production team and to provide an auditable trail of compliance for local regulatory bodies.
Most importantly, the ISC was able to deliver the intervention program safely to protect people, the environment, assets, and the reputations of all stakeholders.
To learn more about the SureTec platform and our PressureTesting solution, contact us!