

A wellbore diagram, or well schematic, provides a visual representation of the well and its components at any phase of the well life cycle. It can also serve as a valuable tool to aid in the planning and execution of well operations, from drilling and completions, to interventions and abandonment.
The detailed graphical information in wellbore schematics display the size (diameter) and length of major components and the depth at which the components are located.
Wellbore diagrams are a critical communication tool for all stakeholders and decision makers. Wellbore diagram programs should have key features like version control and collaboration capabilities to effectively handle risk management and change control. Wellbore schematics also need to be dynamic to track changes over the lifecycle of the well so that data is up-to-date and available on demand. IPT Global’s SureTec® WellSchematic solution is built around these needs, keeping schematics current and accessible across global operations teams.
Importance of Wellbore Diagrams Over the Lifecycle of Wells
The importance of wellbore diagrams cannot be overstated. Over the lifecycle of a well, wellbore diagrams are used for:
Planning & Design
In the planning phase, operators and engineers utilize wellbore schematics to visualize design alternatives for the intended well. This aids in the safe and efficient delivery of both the well and the associated business objectives.
Drilling
When integrated with drilling data acquisition software, wellbore diagrams can be used to communicate operational progress against the plan.
Completions
A wellbore diagram assists engineers in overseeing well barriers and assessing risks, as well as making informed decisions regarding the final positioning of casing strings, production tubing, and other completions equipment. It also influences decisions about future completions opportunities.
Production
Coupled with actual well performance and production rate data, wellbore diagrams can help to identify potential production challenges and risks associated with well integrity issues.
Intervention
Frequently updated wellbore diagrams streamline the decision-making process for well interventions and maintenance, serving as a valuable risk management tool to effectively handle well barrier management for interventions.
Abandonment
As a well reaches the end of its lifecycle, wellbore diagrams play a pivotal role in guiding the placement of cement plugs and other well barriers, ensuring the effective prevention of leaks and environmental contamination. This compliance with policy and regulatory requirements is essential, especially during the well abandonment or plug and abandonment process.
Common Components in Wellbore Schematics
Wellbore diagrams differ in appearance but typically contain these components and symbols.
| Component | Description / Symbol |
|---|---|
| General information | Operator, lease name, well number, rig name, legal location, API number, latitude and longitude, date updated |
| Symbol: Displayed at top of schematic | |
| Elevation | Rotary Kelly Bushing (RKB), Mudline (ML), water depth |
| Symbol: Elevation value located at top of the schematic | |
| TD & PBTD | Total Depth of hole and Plugged Back Total Depth |
| Symbol: Values displayed at bottom of schematic | |
| Hole sections | Diameter, top of measured depth, and measured depth |
| Symbol: Vertical or horizontal dashed lines | |
| Casing | Size, weight, top measured depth (TMD), bottom measured depth (BMD), top of cement (TOC) |
| Symbol: Vertical lines representing different casing strings in the wellbore | |
| Cement | Top and bottom of cement, type of cement, yield and slurry weight |
| Symbol: A shaded area around the casing strings indicating the extent of cement placement | |
| Wellbore components | Packers, plugs, valves, tubing and gas mandrels |
| Symbol: A rectangle across the wellbore placed at a specific depth | |
| Completion components | Tubing hangers, gauges, production tubing, downhole safety valve, side pocket mandrel, slotted liner, landing nipple, etc. |
| Perforation depth | The location of perforations as defined by top measured depth (TMD) and bottom measured depth (BMD) |
| Symbol: Small, vertically aligned dots or short lines along the casing or tubing | |
| Liner | Size, weight, top measured depth (TMD), bottom measured depth (BMD), top of cement (TOC) |
| Symbol: Vertical lines inside the casing but not extending to the surface | |
| Lithology column | Vertical representation of formations encountered as the well is drilled |
| Symbol: Shading or patterns that distinguish one formation from another | |
| Formation tops | The upper boundary of geological formations |
| Symbol: A horizontal line with the name of the formation indicates the top boundary of a specific geological layer | |
| Geological symbols | Marks that represent geological features such as faults, unconformities, anticlines, and synclines |
| Symbol: A jagged or wavy line intersecting the wellbore trajectory | |
| Drilling fluid | Mud density, viscosity, formation pressures, temperature, etc. |
| Perforations | Top, bottom, shots per foot, and phasing angle |
| Symbol: open(green) and squeezed(red) | |
| Wellbore trajectory | Wellbore path from surface to target depth expressed in terms of measured depth, inclination and azimuth angles |
| Symbol: An arrow or curve along the wellbore trajectory shows the direction and angle of deviation during directional drilling |
Depicting Casing & Cement in Wellbore Schematics
 This is where your paragraph text goes. The text will now wrap perfectly around the left side of the right-aligned image because the image is coded inside the text block.
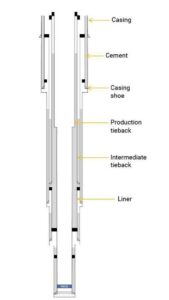
Casing provides structural support to the well and acts as a physical barrier to prevent fluid migration. The casing string consists of casing sections that decrease in diameter with depth. Casing setting points are adjusted to specific depths, for a particular hole diameter. The casing string is run into the wellbore and cemented into place to ensure proper zonal isolation and guarantee impermeable barrier between different formation zones. Casing is often represented in wellbore diagrams using vertical lines to denote different casing sections from the wellhead to the casing shoe. Liners are casing strings that normally run and set within the wellbore and typically do not extend all the way to the wellhead.
Cement is used to create a barrier between the wellbore and the surrounding rock formations. During well construction, the annular space between the casing and the formation is filled w
ith cement. The cement sheath forms a mechanical and hydraulic barrier, preventing fluid migration along the outside of the casing. Cement is depicted in wellbore diagrams by shaded areas that correspond to the depth range where the cement is placed.
A production tieback is typically connected to the top of the production liner or casing string that runs across the production reservoir interval. The primary purpose of a production tieback is to provide a conduit for the flow of hydrocarbons from the reservoir to the surface.
An intermediate tieback is used to isolate a casing string that cannot withstand possible pressure loads during drilling, usually because of excessive wear or higher higher-than than-anticipated pressures. In some cases, intermediate tiebacks may not connect directly to the top of a liner. Instead, they are typically set at a shallower depth and cemented separately from the production liner.
class=”alignright”
Depicting Formation Geology & Lithology in Wellbore Schematics
Subsurface formation boundaries and geological features can be accurately represented in wellbore diagrams to clearly indicate the geological formations encountered at various depths or hole sections. This helps drilling teams understand the lithology and potential reservoir characteristics.
Formation Evaluation Data
Formations are separated by upper and lower boundaries where the rock lithology changes. Subsurface formation data, such as seismic surveys, core samples, and well logs help geologists, drilling engineers, and reservoir engineers accurately place the wellbore in the most favorable locations to optimize drilling efficiency, minimize drilling risks, and optimize future production.
Representing Formation Boundaries & Geological Features
Formation tops represent the upper boundaries of specific geological formation classifications, such as chalk, limestone, shale, and sandstone. They are typically marked with horizontal lines or notches
on the lithology column. Formation tops are labeled with the names of the formations they represent and provide valuable information about the depth at which the different formations are encountered.
Using Annotations & Notes for Enhanced Interpretation of Wellbore Diagrams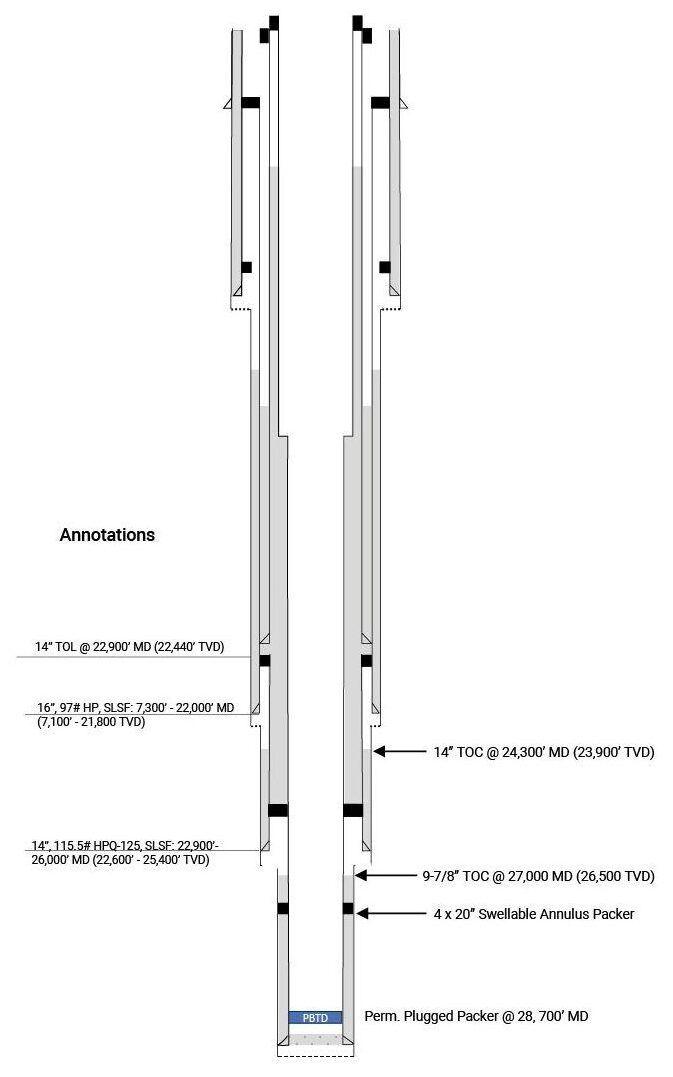
Annotations and labels provide additional information about the formations, features, and wellbore components. They can explain lithology and provide context for significant geological events, seismic characteristics, and more details about wellbore components.
Completions Wellbore Diagrams
A completions wellbore diagram is a visual representation of the components and configuration of the completions equipment within an oil or gas well. It provides a clear and comprehensive overview of how the well is equipped for production, including the arrangement of tubing, casing, packers, and other wellbore elements. It also serves as a detailed record of the completions design and completions equipment(jewelries) configuration for future reference, maintenance, and regulatory compliance. The completions diagram is typically accompanied by detailed annotations, specifications, and a legend to explain the symbols and components used. It serves as a critical reference document for well operators, production engineers, and maintenance teams throughout the well’s life cycle.
Key Features & Functionality of Wellbore Diagramming Software
IPT Global’s WellSchematic solution and other software used to create wellbore schematics typically contain a range of features and functionalities designed to provide a comprehensive and detailed representation of the wellbore.
| Feature | Description |
|---|---|
| Wellbore visualization | Visual display of the wellbore |
| Casing and tubing strings | Generate casing and tubing sections or different sizes (diameter and thickness), depth, and cement sections |
| Deviations and doglegs | Ability to show any deviations or changes in trajectory during drilling |
| Formation tops | Geological data that indicate the depths of different formation tops encountered during drilling |
| Data integration | Integrates real time data from drilling operations such as weight on bit (WOB), rate of penetration (ROP), and rotary speed |
| Completion equipment | Production tubing, packers, plugs, and downhole valves |
| Easy editing | Allows users to modify the wellbore path and components |
| Scale and measurements | Tools to measure and modify distances in angles on the wellbore diagram |
| Survey data | Measure depth, inclination, azimuth, vertical section, northing, easting and readings at various depths |
| Exporting and reporting | Exporting the wellbore diagram in various formats for sharing with colleagues, regulatory authorities, or reports |
| Historical equipment tracking | Records changes to the well’s completion equipment over time |
| Version control | Documenting modifications to the wellbore as it progresses from drilling, completion and production to intervention, and abandonment |
| Geothermal information | Captures Surface Ambient Temperature, Seabed/Mudline Temperature and Formation Temperatures |
| Formation Input / Information | Comprises pore pressure data, fracture gradient data |
Data Accuracy & Quality Assurance in Wellbore Diagram Software
When using wellbore schematics software, accurate data entry, validation, and quality control are crucial to various aspects of safety, compliance, and overall well integrity. Inaccurate data entry can result in errors in well control decision-making, which increases safety risks to personnel, assets, and the environment. Erroneous data entries might result in redesigns, corrosion, collapses, or obstructions in the wellbore. For well operations that are subject to regulatory oversight, inaccurate wellbore schematics can lead to non-compliance, resulting in fines or other legal consequences. Inaccuracies could also lead to improper placement of critical wellbore elements, compromising the well’s structural integrity and potentially causing leaks or other problems of over the life of the well. Using wellbore management diagram software with built-in validation checks and data consistency features can help reduce the risk of errors and assist in diagnostics if integrity or production issues arise.
Version Control of Wellbore Diagrams
As a well progresses from planning to drilling, completion, production, and abandonment, various wellbore modifications occur. It’s important to keep the wellbore diagram schematic up to date to reflect the specific state and configuration of the well at a given point in time, as well as store all changes that have taken place. Version control is fundamental to change-management processes.
Importance of Keeping Wellbore Diagrams Current
Version control, or versioning, is the practice of documenting changes to wellbore diagrams over a well’s lifecycle to accurately reflect modifications during drilling, completion, workovers, interventions, and abandonment. Each version of the wellbore diagram reflects the specific state and configuration of the well at a given point in time, carrying significant implications for decision-making, regulatory adherence, troubleshooting, and collaboration. This becomes particularly crucial as the responsibility for the well transitions from one department to another throughout its lifespan. Incorporating well-defined approval signatories and technical authorities into the process is an essential requirement for ensuring well integrity.
How Wellbore Diagram Software Applications Handle Versioning
Wellbore diagram applications have different forms of version control with the goal of a single source of truth. Some applications have project management features that enable users to track versions of wellbore diagrams while other applications may simply record edits and modifications made to a wellbore diagram. Other applications not only store previous wellbore diagram versions but also alert all relevant users when changes are made to a wellbore diagram so they can update it in their local repository.
Enhance Well Operations with Wellbore Schematic Software
Wellbore diagrams are indispensable tools in the oil and gas industry, contributing to the efficient and safe operation of wells. Their role in visualizing, documenting, and communicating wellbore information underscores their importance in every aspect of well management. To ensure successful well operations, it is crucial to adopt wellbore diagram software that makes creating wellbore diagrams easy and maintains data accuracy and version control. Contact us for information about IPT Global’s Wellbore Schematic Tool.
To learn how IPT Global’s WellSchematic solution—with barrier diagrams—can support your wellbore schematic needs, contact us today.