
Transitioning from pen and paper to digital data
For over a century, the oil and gas industry has relied on circular chart recorders (CCR) to document the pressure tests that verify well integrity and protect personnel, assets, and the environment. A CCR uses a mechanical pen to trace pressure readings onto a rotating paper chart, which is then interpreted by eye. That makes the result only as reliable as the tester reading it, and small deviations can be difficult to see.
Digital pressure testing replaces that subjective read with an objective interpretation based on accurate, high-resolution data that is tamper-proof and auditable. Digital data also allows for Cloud-based archival of the well history and KPI tracking, which makes performance visible, helps to identify learning opportunities, and closes process safety gaps while reducing opportunities for human error.
Circular chart recorders vs. digital pressure testing: an operator trial
Although the industry began moving away from CCRs more than a decade ago, they are still in use on many rigs. In 2020, IPT Global worked with a major operator to compare the two approaches—CCR and digital pressure testing—directly.
The operator, which runs active offshore and onshore operations worldwide, wanted to standardize assurance and efficiency across all of its business units and projects. That goal created an opportunity to improve its integrity validation workflows, from planning and execution to after-action reviews and data archival for their onshore operations.
IPT Global conducted the trial across four of the operator’s rigs, with CCRs and SureTec® PressureTesting run side by side. Our well integrity advisor then led after-action reviews with rig and office teams, focusing on operational changes made during testing, deviations from API standards, and a breakdown of online and offline testing time. Because the PressureTesting solution stores data in the Cloud, the team was able to analyze performance quickly.
What the test data showed
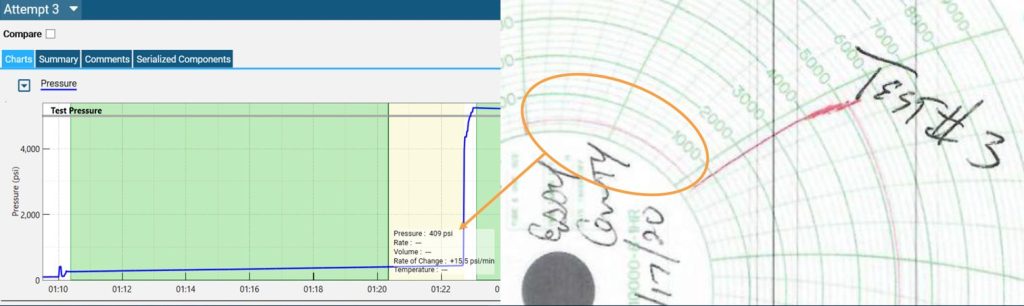
API Standard 53 requires that a low-pressure test shall pass between 250-350 psi. In figure 1, PressureTesting shows the low-pressure test was held at 409 psi, above the API Standard 53 range. On the CCR, that discrepancy is difficult to see, which leaves the result open to interpretation.
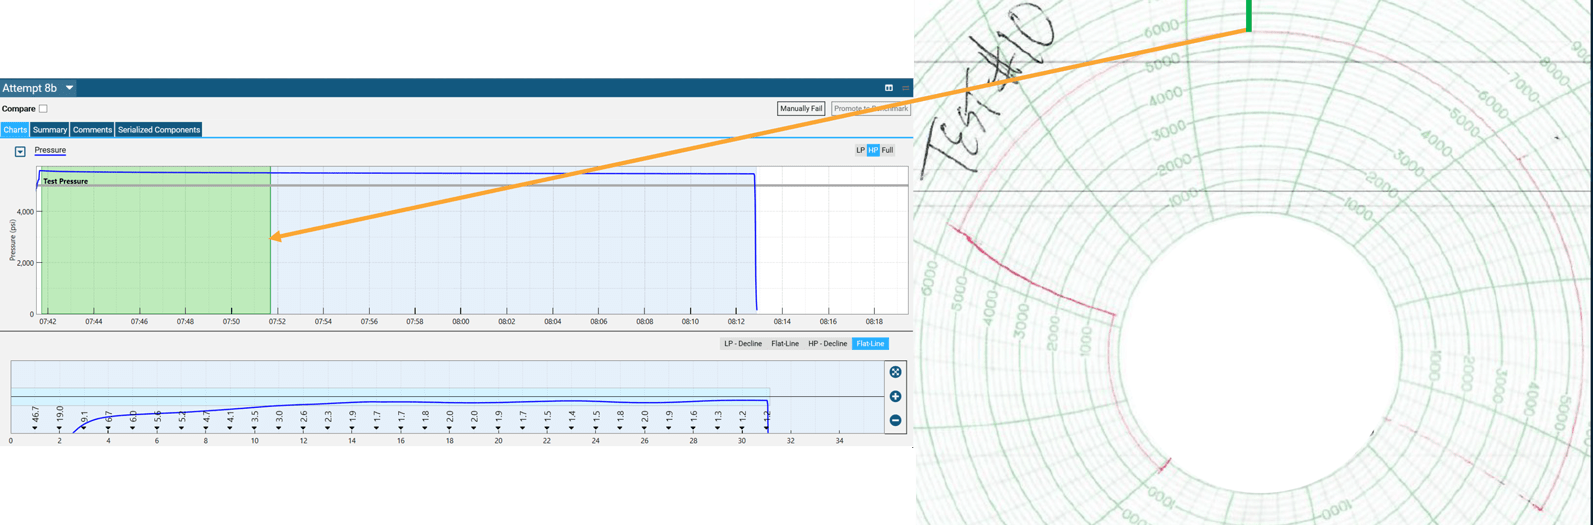
Illustrated in Figure 2, the test passed the approved criteria at minute 10 with PressureTesting. The test was then held out for an additional 21 minutes on the CCR. This additional time was caused by the subjective review by the tester.
A higher level of assurance with SureTec PressureTesting
IPT Global and our client agreed on several KPIs and objectives for the trial. SureTec provided integrity, assurance, performance, and compliance not possible using an analogue approach and CCR. The trial highlighted the opportunities and influenced new standards and process improvements.
Benefits to the level of assurance provided by SureTec PressureTesting included:
- Change Management: Ability to quickly adapt and document changes to test plans and operational sequence. All changes were tracked and documented in the test report and stored on the Cloud.
- Compliance: Providing assurance that internal standards comply with regulations is an integral part of the SureTec platform. Well barrier integrity verification with objective results, plus automated alerts, provided immediate notification of failed objectives / components.
- Assurance and Efficiency: The ability to remotely monitor active tests from anywhere in the world with our Cloud-based tool supports collaboration across teams for problem-solving and rapid uptake of best practices.
- Safety and Efficiency: Generation of test schematics provides simple visualization of blowout preventer (BOP) and manifold alignment reduces communication errors, raises crew awareness, and improves safety.
- Performance and Efficiency: Helps provide an understanding operational time breakdown, allowing teams to identify improvement opportunities and drive performance and efficiency.
- Archive and Reporting: Cloud-based data archives efficiently generates performance analysis and post-job reports.
Making the shift to digital pressure testing
This trial gave the operator a clear, data-backed view of what its CCRs were missing. SureTec PressureTesting delivered objective, tamper-proof, and auditable results for well barrier integrity validation, and the process and performance gaps it revealed led to lasting changes in the operator’s programs and standards.
As the operator put it during implementation, “I’m so happy we are making the switch. Using this digital tool and being involved in the digital transformation is critical for assurance and driving efficiency.”
If your operation still relies on circular chart recorders, contact IPT Global to see what digital pressure testing can show you.